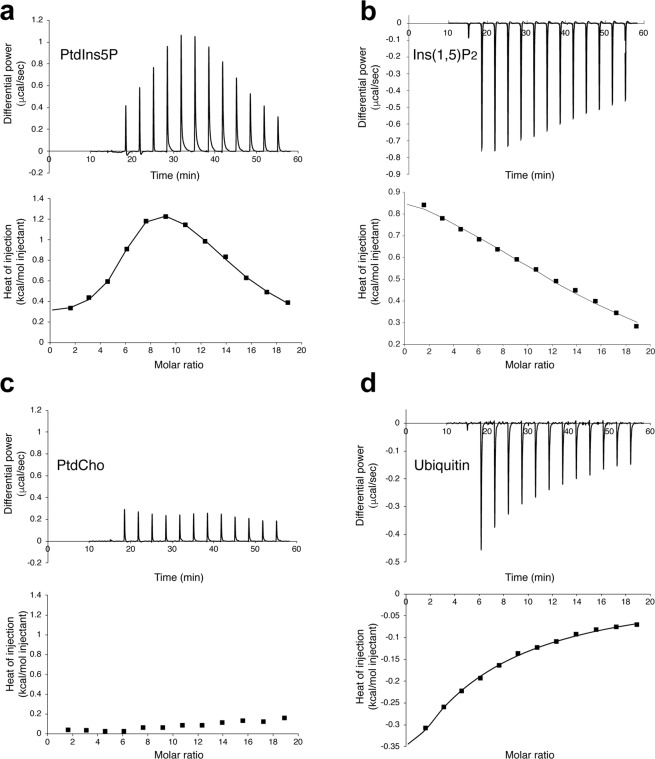
Figure 5.
Tom1 VHS calorimetric titration curves for the association to PtdIns5P (a), Ins(1,5)P2 (b), PtdCho (c), and ubiquitin (d). The upper panels depict the heat change produced upon successive injections of the indicated ligand to the Tom1 VHS domain. The lower panels display the integrated binding isotherms as a function of ligand/protein ratio. Binding isotherms were fitted to the subtracted data using two-sites (PtdIns5P) or one-site (Ins(1,5)P2 and ubiquitin) binding models. Each titration was carried out at least two times and representative results are shown.

