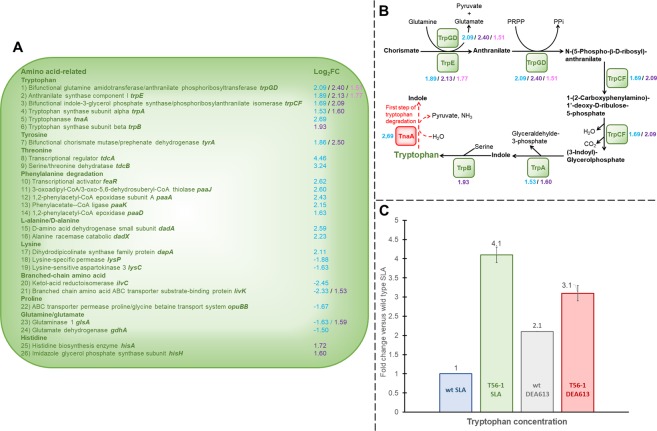
Figure 5.
Amino acids metabolism in the DEA613-adapted strain T56-1. (A) Differential expression of genes involved in amino acids metabolism. (B) The tryptophan biosynthesis pathway. Log2FC values in blue, purple and pink represent adapted T56-1 versus wt both grown under DEA613, UPA230-grown wt versus SLA-grown wt, and DEA613-grown wt versus SLA-grown wt, respectively. (C) Tryptophan concentration fold change in both adapted strain T56-1 and wt grown under SLA or DEA613. Tryptophan concentration results were normalized with OD 600 nm and are the mean and standard deviation of three replicates.

