Figure 1.
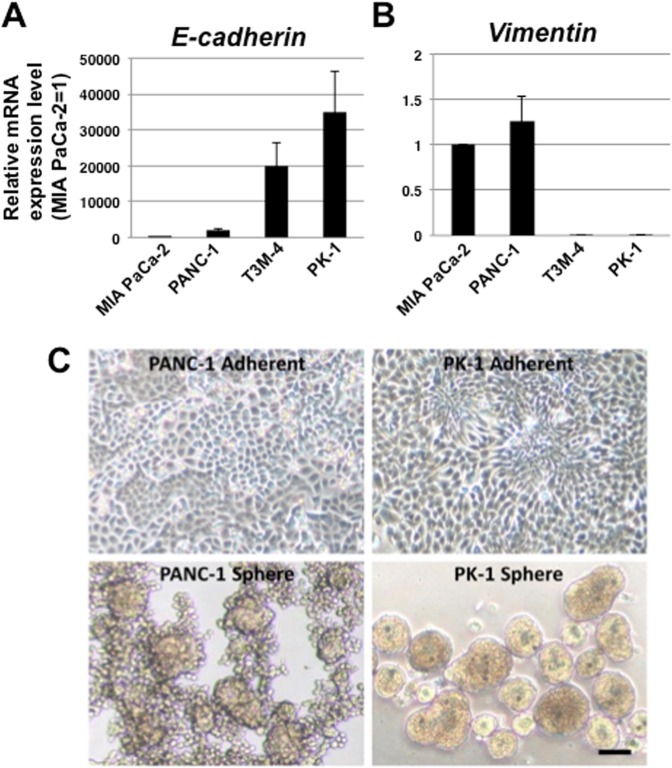
qRT-PCR analysis of four human PDAC cell lines and phase contrast images of PANC-1 and PK-1 under 2D- and 3D-culture conditions. E-cadherin and vimentin expression levels were examined using qRT-PCR. There was a 35,000-fold difference in E-cadherin mRNA levels among the cancer cell lines. (A) Vimentin and E-cadherin expression levels were inversely correlated in each PDAC cell line. (B) Results are presented as means ± SD from three independent experiments. The results are shown after normalization to the values obtained for MIA PaCa-2 cells (value = 1). In 2D-culture, PANC-1 cells showed sheet-like proliferation, and PK-1 cells showed a rosette-like appearance (C, upper panel). In 3D-culture, PANC-1 cells formed spheres with a grape-like appearance (lower panel). PK-1 cells formed round to oval-shaped spheres. Scale bar = 200 μm.

