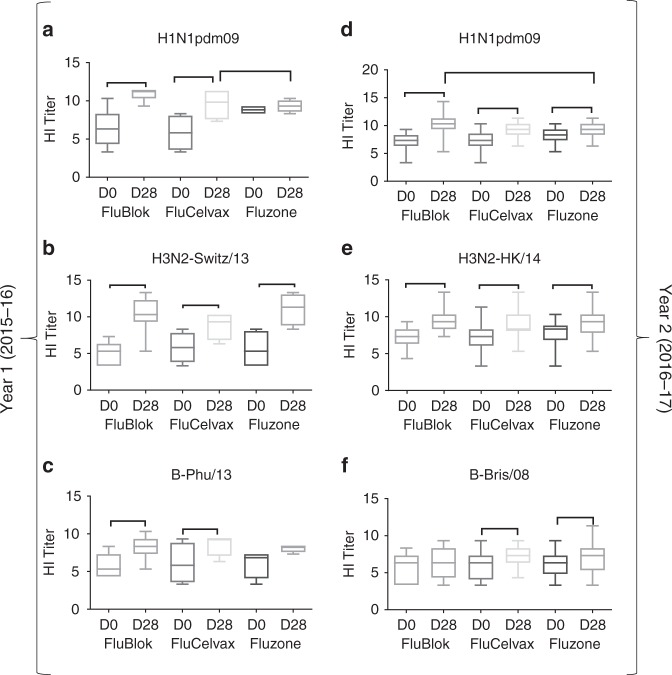
Fig. 1.
HI titers following vaccination with FluBlok, FluCelvax, and Fluzone. a–f Average HI titers against H1N1pdm09 (a, d), H3N2 (b, e), and influenza B (c, f) virus strains pre-vaccination (D0) and post-vaccination (D28) are shown for FluBlok, FluCelvax, and Fluzone (excluding repeat vaccinators, see Table 2), in the first (2015–2016) year (a–c) and second (2016–2017) year of the study (d–f). The box and whisker plot show the median value and the minimum and maximum values. For the Day 28 post-vaccination HI titers and fold change from Day 0, an ANCOVA model was used for comparison between the vaccine groups, adjusted for gender, age, and baseline (Day 0) values (Supplementary Tables 2 and 3). Statistically significant differences between groups and pairs are indicated by horizontal bars. Source data are provided as a Source Data file

