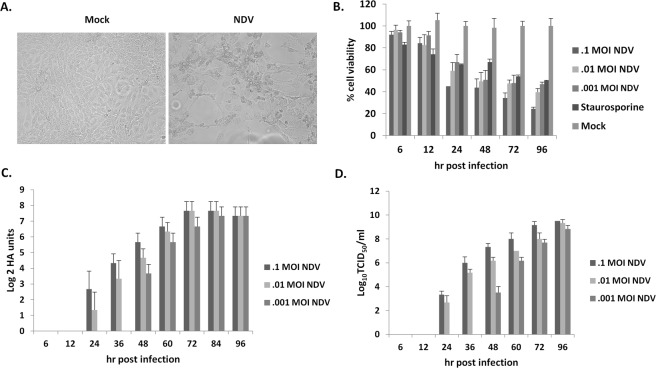
Figure 1.
NDV related kinetics and cytotoxicity in SAS cells. The images show cell control, and NDV specific cytopathic effects (A). The images were taken at 20X magnification under EVOS FLoid cell imaging station (ThermoFisher Scientific, USA). SAS cells were infected with different MOI and MTT assay was performed at regular time intervals (B). Time-course viral growth kinetics were NDV was infected at different MOI and the supernatant was collected for virus titration by HA (C) and TCID50 method (D). MTT, HA, and TCID50 data represent the mean ± SD of three independent experiments.

