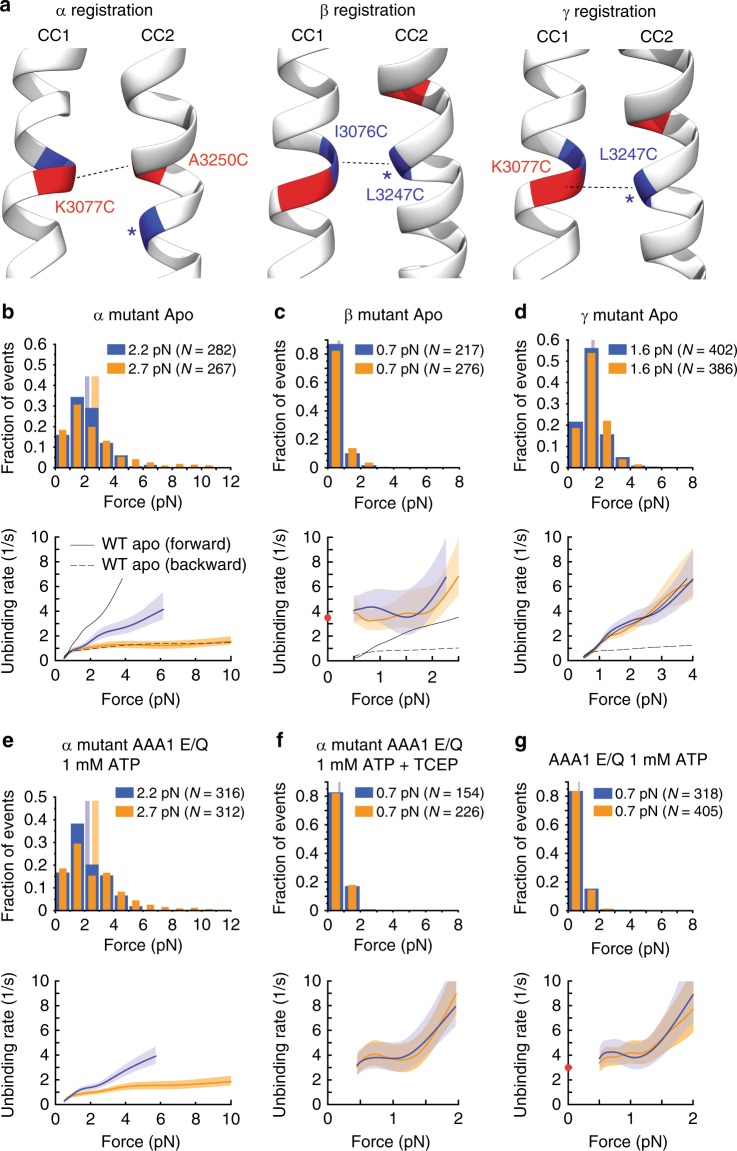
Fig. 3.
Tension direction alters dynein MT-binding strength via sliding of the stalk helices. a High-affinity (α), low-affinity (β) and intermediate-affinity (γ) helix registrations of the dynein stalk generated from the morphing structure described in the Supplementary Note 1. b, top: Normalized histograms of primary forward and backward unbinding forces for the Dyn1331kDa-α CL mutant, with mean values noted (95% CIs [2.0, 2.3] and [2.5, 3.0] pN, estimated by bootstrapping 4000 samples). b, bottom: Unbinding rate vs. force derived from the data above. The shaded areas are 95% CIs for the mean rates, estimated by bootstrapping. c As in (b), but for the Dyn1331kDa-β CL mutant (95% CIs [0.6, 0.7] and [0.7, 0.8] pN). The depicted zero-load unbinding rate of 3.5 ± 0.1 s−1 (characteristic rate ± SEM) (red circle) represents the inverse of the time constant obtained from the CDF analysis of the MT-bound lifetimes measured via TIRF microscopy (Supplementary Fig. 2c) (the 95% CIs of the measured unbinding rate (lower limit, 3.3/s; upper limit, 3.6/s) are not shown as they are shorter than the height of the symbol). d As in b, but for the Dyn1331kDa-γ CL mutant (95% CIs [1.5, 1.7] and [1.6, 1.7] pN). e As in (b), but for the AAA1 E/Q Dyn1331kDa-α CL mutant and 1 mM ATP (95% CIs [2.0, 2.3] and [2.5, 3.0] pN). f As in (e), but with 2 mM TCEP to cleave the disulfide bonds of the stalk helices (95% CIs [0.6, 0.8] and [0.7, 0.8] pN). g As in (b) but for the AAA1 E/Q Dyn1331kDa mutant and 1 mM ATP (95% CIs [0.7, 0.7] and [0.7, 0.7] pN). The depicted zero-load unbinding rate of 3.0 ± 0.1 s−1 (red circle) was derived from Supplementary Fig. 2d as described for the zero-load unbinding rate in c (the 95% CIs of the measured unbinding rate (lower limit, 2.8/s; upper limit, 3.1/s) are not shown as they are shorter than the height of the symbol). For comparison, the force-dependent unbinding rates of the WT motor in the apo state are shown in (b–d) (dashed and solid black lines). Source data are provided as a Source Data file

