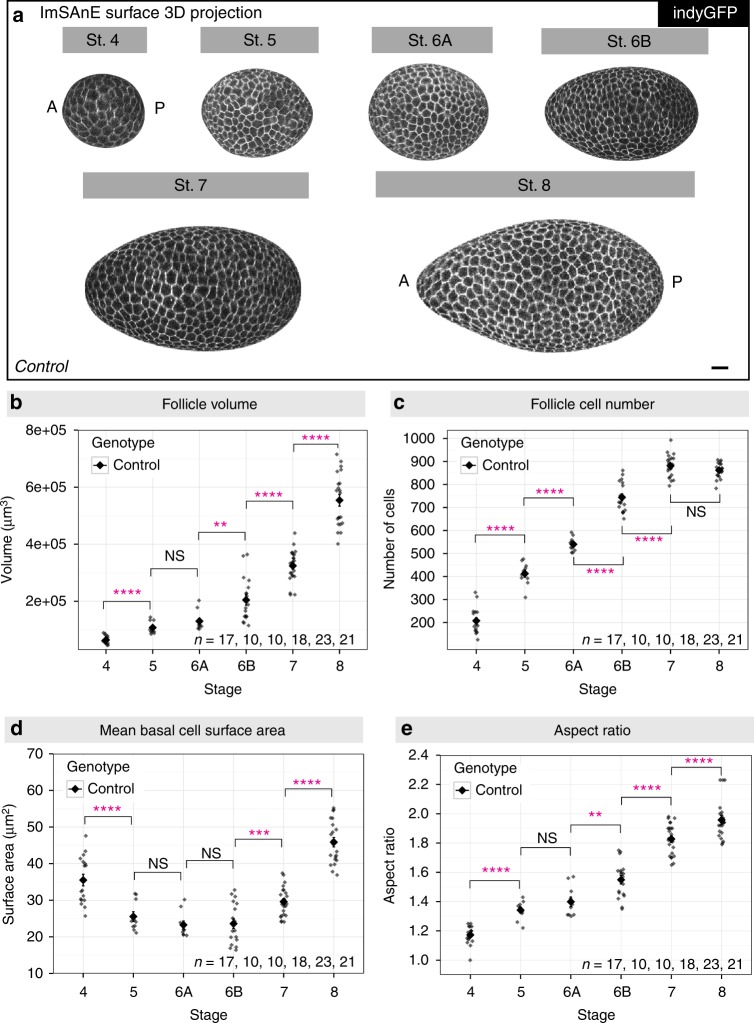
Fig. 2.
Tissue and cellular level morphometrics of wild-type follicles. a Representative ImSAnE surface 3D projection of Indy-GFP (gray) expressing follicles at stage 4–8. Note the increased elongation of stage 6B follicles as compared to stage 6 A. Scale bar, 10 μm. b Follicle volume increases ~exponentially during these stages, ~9-fold from stage 4–8. P values = 7.1e-05, 0.09, 0.0015, 4.6e-06, and 4.4e-11; two-sided Welch’s t test. c Follicle cell number increases ~linearly with stage, correlates with most morphological criteria, and can be used to define boundaries for each stage. Follicles at stage 7 have reached their maximum cell number. P values = 2.5e-09, 5.1e-06, 1.8e-11, 1.9e-08, and 0.12; two-sided Welch’s t test. d Mean basal surface area of each follicle cell increases at stage 7 with the transition from cell division to endoreplication. P values = 5.3e-05, 0.19, 0.84, 0.0005, and 1.8e-12; two-sided Welch’s t test. e Kinetics of follicle elongation. P values = 2.0e-06, 0.16, 0.0024, 7.8e-09, and 9.8-e03; two-sided Welch’s t-test. n, biologically independent samples. Error bars, s.e.m. NS not significant, **P < 0.01, ****P < 0.0001

