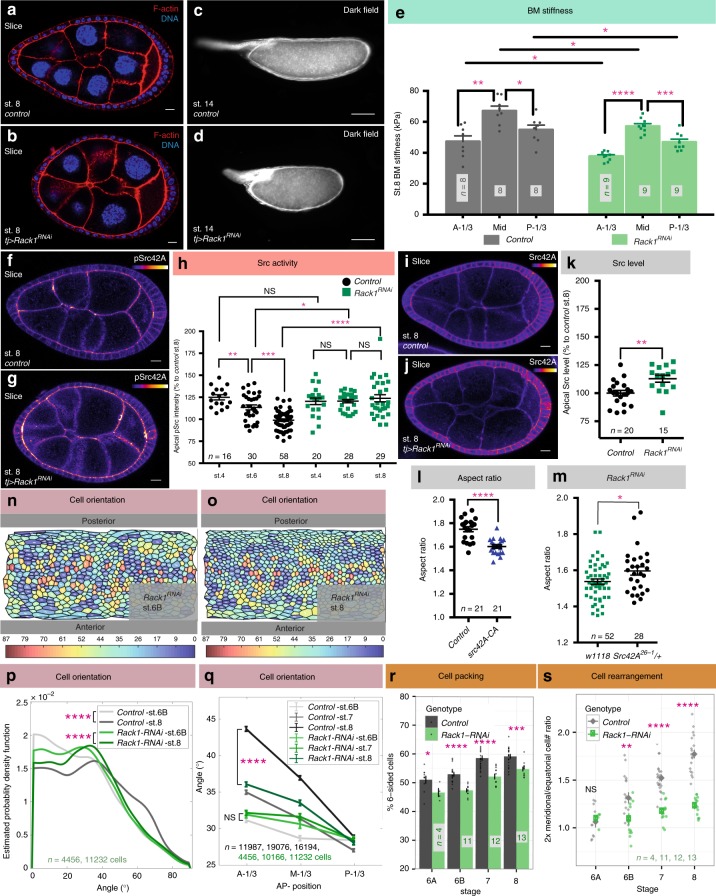
Fig. 6.
Src regulator Rack1 controls cell reorientation and follicle elongation. a–d RNAi-mediated depletion of Rack1 produces round follicles (b) and round eggs (d) compared to controls (a, c). e AFM analysis of the BM of Rack1-depleted follicles shows preservation of an AP gradient of stiffness, although average stiffness is slightly decreased. P values between control at different positions = 0.0011 and 0.013, between Rack1RNAi at different positions = < 0.0001 and 0.0009, between control and Rack1RNAi = 0.037(A-1/3), 0.016(M-1/3), and 0.045(P-1/3); two-sided Welch’s t test. f–h Rack1-depleted follicles (g) show increased levels of pSrc at apical junctions compared to wild type (f). In (h), P values between control stage-4 and 6, stage-6 and 8 = 0.007 and < 0.0001; between Rack1RNAi stage-4 and 6, stage-6 and 8 = 0.96, 0.47; between controls and Rack1RNAi s = 0.34, 0.04, < 0.0001; two-sided Welch’s t test. i–k Levels of apical Src42A are increased in Rack1-depleted follicles. P values = 0.0031; two-sided Welch’s t test. l Hyperactivation of Src42A impairs follicle elongation. m Heterozygosity for Src42A partially suppresses elongation defects of Rack1-depleted follicles at stage 8. n, o ImSAnE cylinder projections of stage 6B and stage 8 Rack1-depleted follicles, color-coded for cell orientation (0° = latitudinal; 90° = AP). p Distributions of cell orientation in wild type and Rack1-depleted follicles. P values = 3.27e-83 and 8.97e-06; Two-sample Kolmogorov–Smirnov test. n = number of follicle cells. q Cells in the anterior third of Rack1-depleted follicles fail to reorient towards the AP. P values between stage 6B control and Rack1RNAi = 0.18 (A-1/3), 0.004 (M-1/3), and 0.91 (P-1/3); two-sided Welch’s t test. P values between stage 8 control and Rack1RNAi = 1.51e-58 (A-1/3), 8.31e-13 (M-1/3), and 0.01 (P-1/3); two-sided Welch’s t test. n = number of follicle cells. r Rack1-depleted follicles impair to rearrange cells to reduce tissue disorder. P values = 0.046, 1.6e-06, 9.3e-09, and 0.0001; two-sided Welch’s t test. s Rack1-depleted follicles fail to rearrange cells from the equatorial to meridional. P values = 0.66, 0.00962, 2.67e-08, and 2.10e-12; two-sided Welch’s t test. Error bars, s.e.m. Except for (p, q), n, biologically independent samples. NS not significant, *P < 0.5, **P < 0.01, ***P < 0.001, ****P < 0.0001. scale bars in (a, b, f, g, i, j), 10 μm and in (c, d), 100 μm. Source data are provided as a Source Data file

