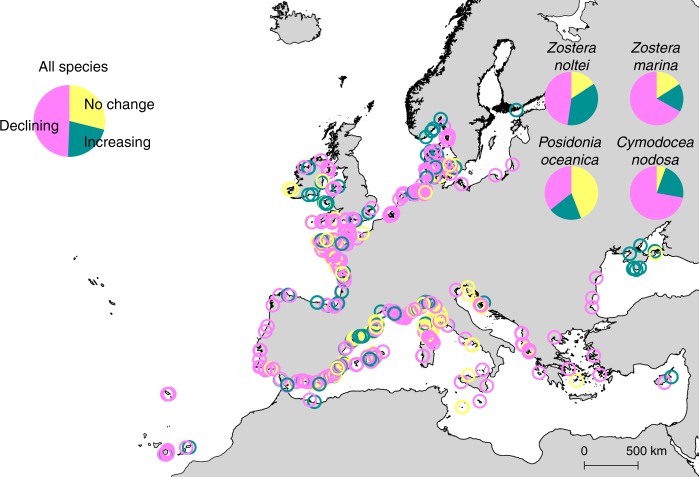
Fig. 1.
Distribution of compiled seagrass sites in Europe and their trajectories. Seagrass sites in Europe showing no change (yellow circles, n = 213), increase (green circles, n = 160), and decline (magenta circles, n = 364) trajectories based on the available time series reports between 1869 and 2016, thus corresponding to different time windows. Pie charts show the overall and species-specific frequencies of trajectories. Number of sites showing decline, increase, and no change trajectories are, respectively: 128, 72, and 158 for Posidonia oceanica; 146, 37, and 35 for Zostera marina; 39, 12, and 3 for Cymodocea nodosa; and 51, 39, and 17 for Zostera noltei

