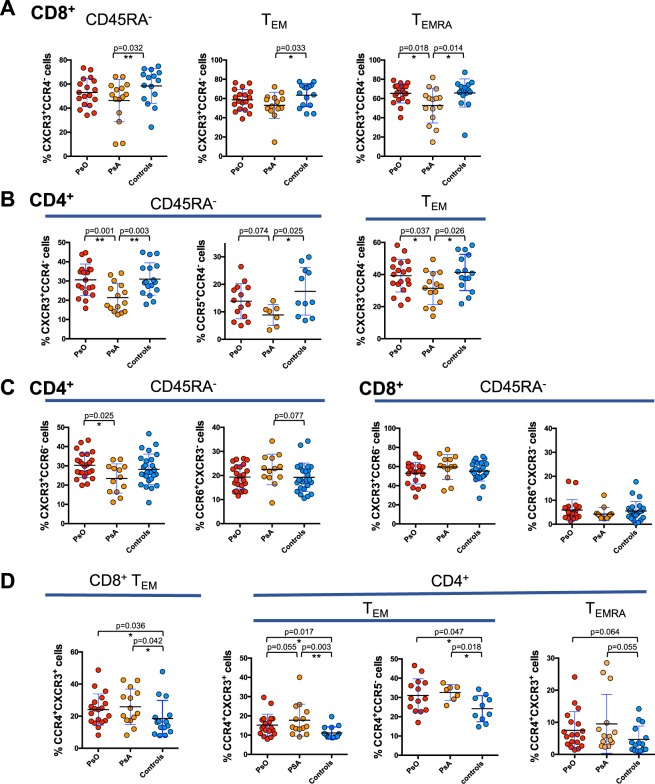
Figure 3.
Contraction of CXCR3+ subsets in circulating memory T cells from PsA patients. PBMCs isolated from patients with PsA, PsO patients and control subjects were stained for CD4 and CD8 lineage markers, memory T cell phenotype markers (CD45RA and CCR7) and for chemokine receptors CCR4, CXCR3, CCR6 or CCR5. Percentages of T cells expressing CCR4, CXCR3, CCR6, CCR5 chemokine receptors in the total memory CD45RA−, TEMRA and TEM subsets of CD4+ and CD8+ T cells are shown in the figure. Statistical analysis of the differences was performed by Mann-Whitney test. p values < 0.05 were considered significant: *p < 0.05, **p < 0.01.

