Fig. 1.
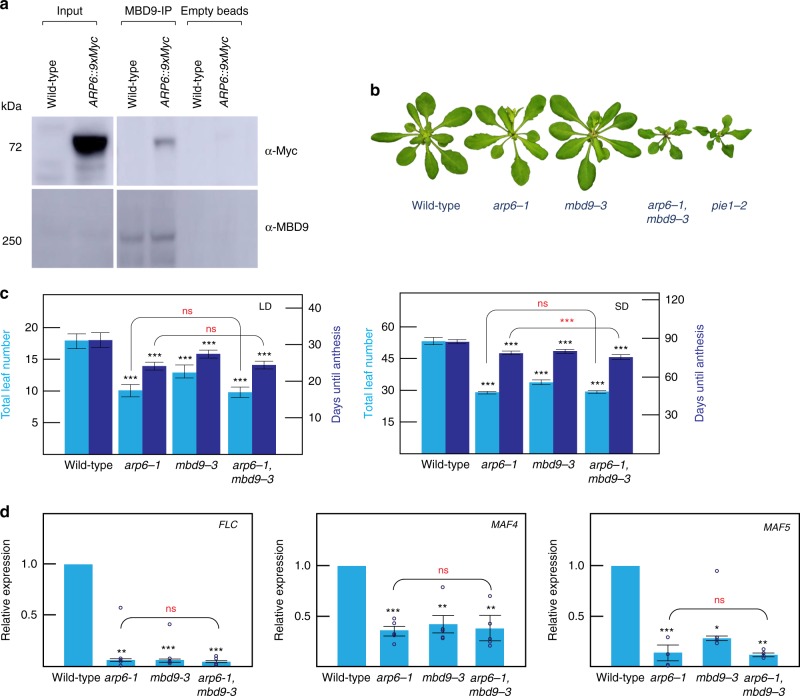
ARP6 and MBD9 interaction and phenotype of the mutants. a Pull-down and co-immunoprecipitation assay. Empty bead lanes serve as negative controls. For each western blot, the antibody used is indicated to the right. b Phenotype of arp6-1, mbd9-3, arp6-1 mbd9-3, and pie1-2 mutants. Plants were grown for 4 weeks (b) or 5 weeks (c) under long-day (LD) conditions (16 h light, 8 h dark) and short-day (SD) conditions (8 h light, 16 h dark). Flowering time expressed as the number of days from germination to anthesis as well as the total number of leaves produced by wild type, arp6-1, mbd9-3, and arp6-1 mbd9-3 under the same conditions are shown. Averages from 16 plants ± standard deviations are shown. Paired two-tailed Student’s t-test was used to determine significance between wild type and mutants (black asterisks) or between mutants (red asterisks); ns p value >0.05, *p value ≤0.05, **p value ≤ 0.01, ***p value ≤0.001. d Relative expression levels of FLC, MAF4, and MAF5 in wild type, arp6-1, mbd9-3, and arp6-1 mbd9-3. UBQ10 was used as an internal control for expression analyses. Average expression levels from three independent replicates ± standard deviations are shown. Paired two-tailed Student’s t-test was used to determine significance between wild type and mutants (black asterisks) or between mutants (red asterisks); ns p value >0.05, *p value ≤0.05, **p value ≤ 0.01, ***p value ≤ 0.001. Source data for Figs. 1a, 1c, and 1d are provided as Source Data file

