Fig. 3.
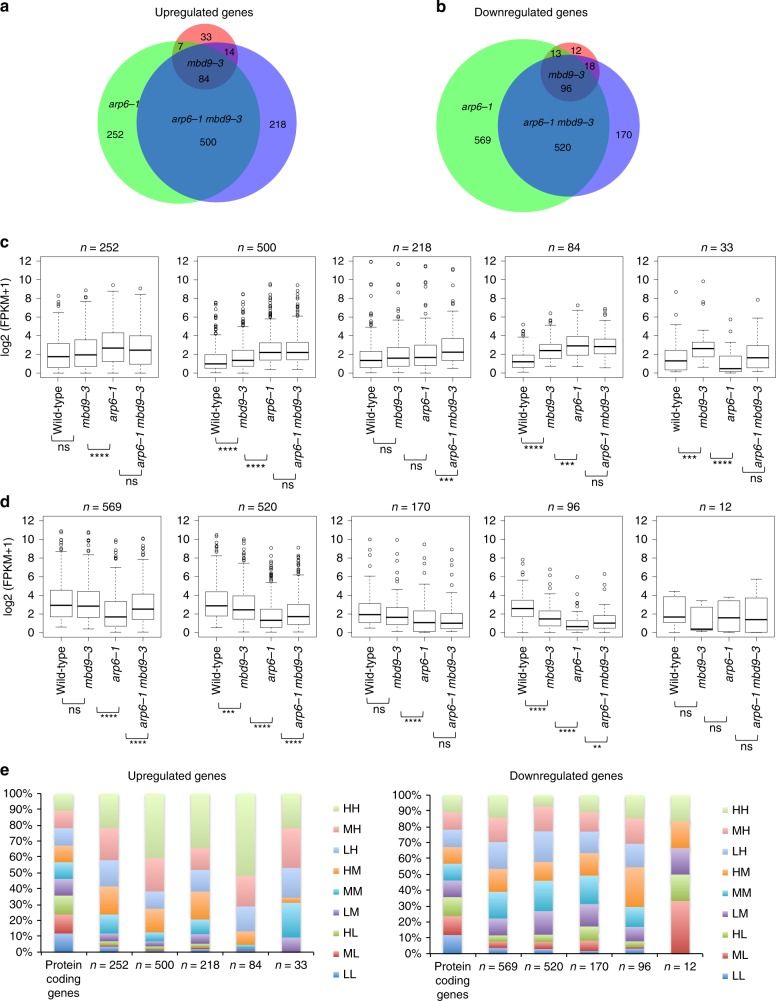
RNA-seq and H2A.Z levels in wild type and mutants. a Overlap between significantly (log2 ≥ 1, FDR ≤ 0.05) up-regulated and b down-regulated genes for each mutant vs wild-type control. Boxplots of average normalized RNA-seq reads log2 (FPKM + 1) represent different classes of overlapping and non-overlapping c up-regulated and d down-regulated genes based on intersection. Center line indicates the median, upper and lower bounds represent the 75th and the 25th percentile, respectively, whiskers indicate the minimum and the maximum, and outliers are represented as circles. Unpaired two-samples Wilcoxon test was used to determine significance: ns p value > 0.05, *p value ≤ 0.05, **p value ≤ 0.01, ***p value ≤ 0.001, ****p value ≤ 0.0001. e Intersection of up-regulated and down-regulated genes with nine classes of genes characterized by their distribution of H2A.Z in wild type at TSS and gene body. Labels H—high, M—medium, L—low refer to levels of H2A.Z at TSS (first letter) and gene body (second letter). Source data are provided as Source Data file

