Fig. 5.
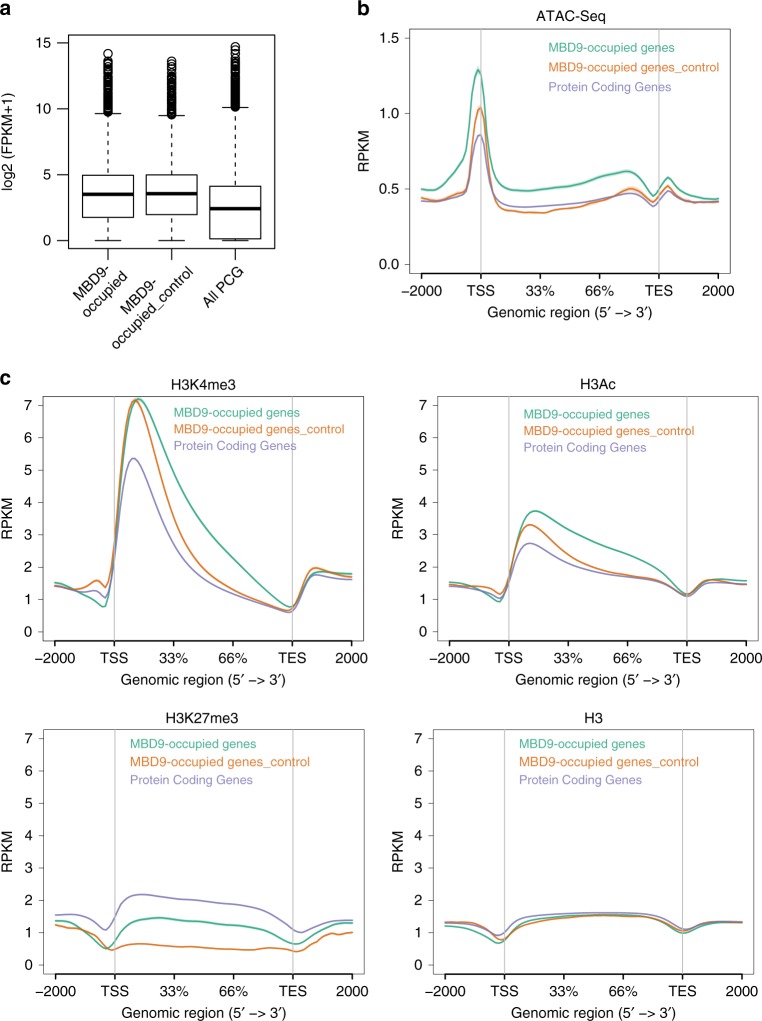
Chromatin features at MBD9-occupied genes. a Boxplots of average expression levels log2 (FPKM + 1) from RNA-seq in wild type for MBD9-occupied genes, MBD9 control genes, and protein-coding genes. Center line indicates the median, upper and lower bounds represent the 75th and the 25th percentile, respectively, whiskers indicate the minimum and the maximum, and outliers are represented as circles. b Distribution of normalized ATAC-seq levels (RPKM) over MBD9-occupied genes, MBD9 control genes, and protein-coding genes. c Distribution of normalized levels (RPKM) for H3K4me3, H3Ac, H3K27me3, and H3 ChIP-seq in MBD9-occupied genes, MBD9 control genes, and protein-coding genes

