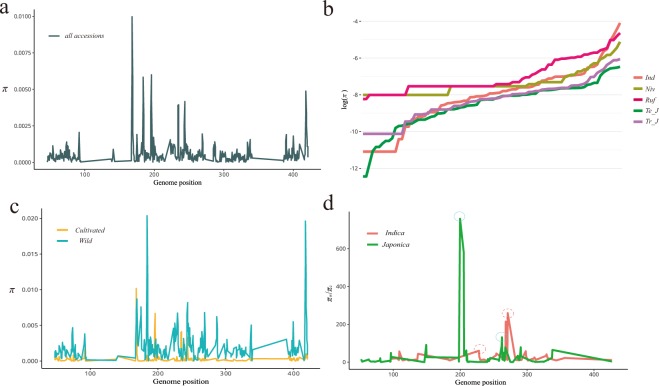
Figure 2.
Nucleotide diversity and selection analysis of all accessions and subgroups. (a) Nucleotide diversity of all accessions. A 500 bp window size was used in this analysis. (b) Nucleotide diversity of subgroups. The sorted values were plotted in each group. Ind: indica; Niv: O. nivara; Ruf: O. rufipogon; Te_J; temperate japonica; Tr_J; tropical japonica. (c) Nucleotide diversity of cultivated rice and wild rice. (d) The reduction in nucleotides was calculated based on previous diversity analysis. The threshold of the top 5 percentile is indicated as a red dotted circle for indica and blue circle for japonica. The regions within the 2.5 percentile are considered candidate regions under selection. The genome position unit is kb.

