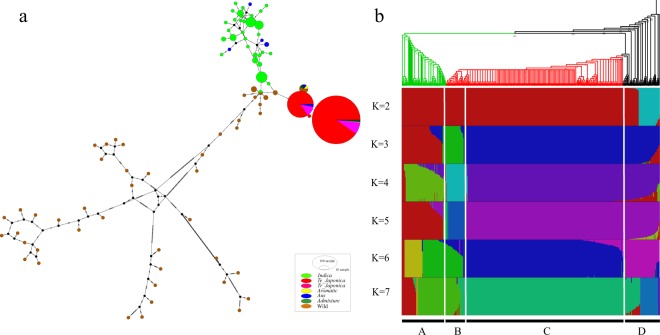
Figure 4.
The haplotype network, population structure and phylogenetic tree of 412 rice accessions. (a) The haplotype network of 412 rice accessions. Here, different colors represent different populations, and circle size represents the number of samples. (b) Population structure and phylogenetic tree are displayed using a rectangular cladogram. A: indica; B: tropical japonica; C: temperate japonica; D: aromatic, aus and admixture type; E: wild rice.

