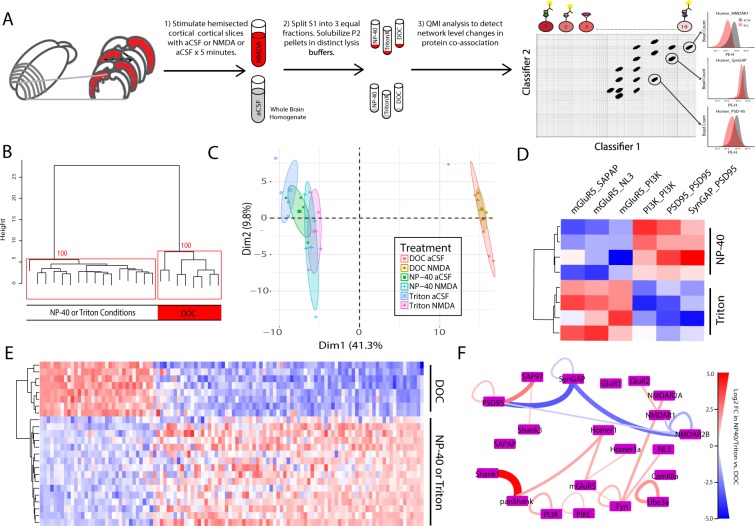
Figure 7.
Multiplex IP-FCM detects more complexes in NP-40 or Triton Conditions: (A) Workflow. (B) Unsupervised hierarchical clustering of all conditions. Numbers at the branch points show the approximately unbiased (AU) p value calculated by multiscale bootstrap resampling; clusters with AU greater than 95 are boxed in red. (C) PCA of all conditions. Note DOC and NP-40/Triton conditions separated by both hierarchical clustering and PCA. (D) Heatmap of 6 interactions identified as significantly different between NP-40 and Triton conditions by ANC ∩ CNA analysis. (E) Heatmap of 112 interactions identified as significantly different between either DOC vs. NP-40 or DOC vs. Triton conditions. Note that hierarchical clustering again separated NP-40 and Triton conditions from DOC. (F) QMI map of the all interactions that exhibited greater than a >2-fold difference between DOC and NP-40/Triton conditions. The thickness and color of lines connecting protein nodes indicate the direction and magnitude of the fold change with interactions that are higher in NP-40/Triton colored red and interactions that are higher in DOC colored blue.

