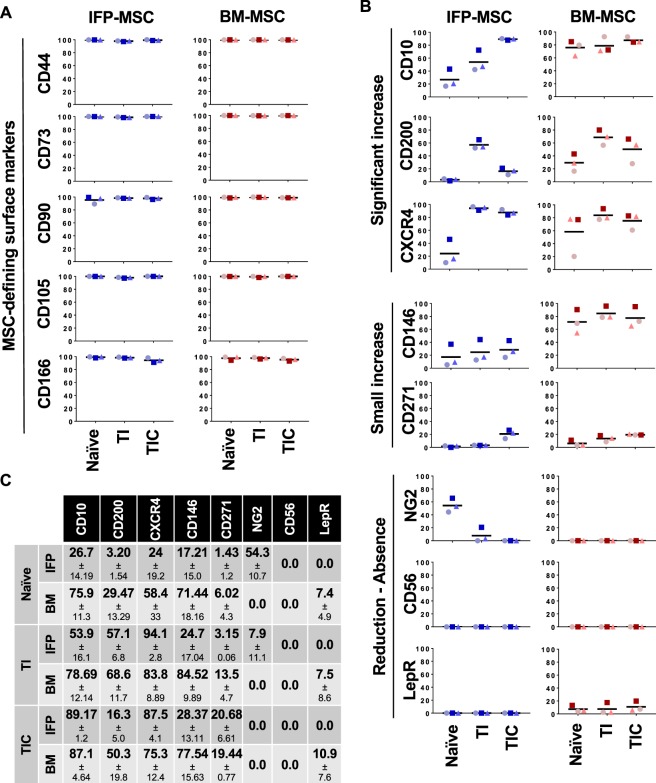
Figure 2.
IFP-MSC and BM-MSC immunophenotypic profile pre- and post-TI and TIC priming. MSC-defining (A) and multiple (B) cell surface markers in pre (naïve) and post TI and TIC priming in both IFP-MSC and BM-MSC, quantified in (C). All experiments (n = 3) were performed independently (3 different donors) and data are presented as scatter plots with mean. Individual donors in each MSC type are presented with distinctive shapes and colour tones to allow intra-donor comparisons between naïve and both primed methods.

