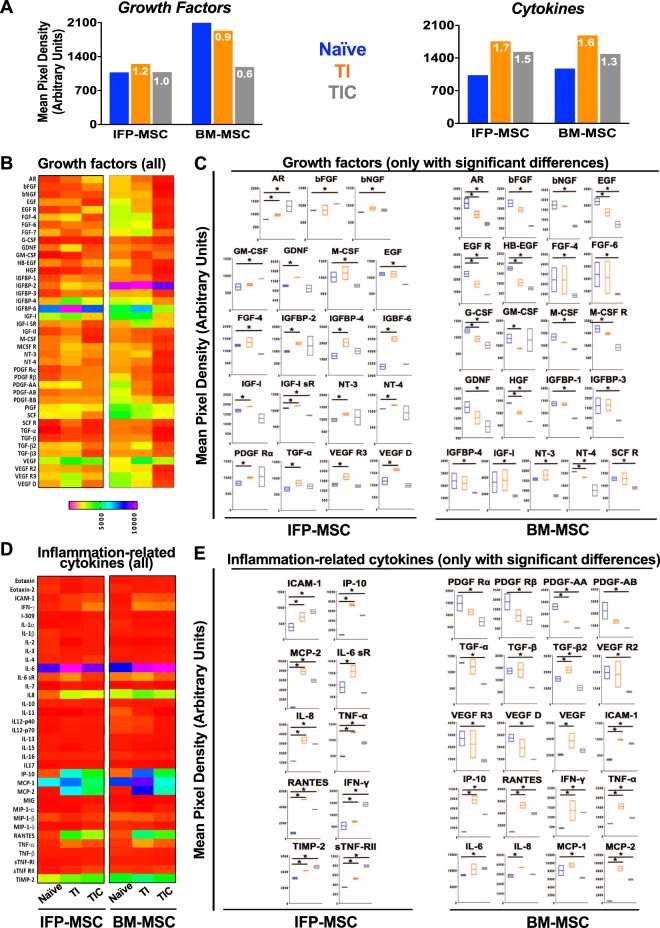
Figure 4.
IFP-MSC and BM-MSC secretory profiling pre- and post-TI and TIC priming. (A) Growth factors and cytokines secretion in all groups, showing overall quantified fold signal (TI and TIC compared to naïve). (B,D) Heat maps of the growth factor (B) and inflammation-related cytokines (D) secretory profile of naïve, TI and TIC primed IFP- and BM-MSCs, showing only proteins with statistically significant changes in C and E, respectively. Heat maps colours are assigned according to a molecule concentration relative scale, from 0 to 10,000. All experiments (n = 2) were performed independently (2 different donors) and data are presented as floating bars with minimum, maximum and mean. Paired and unpaired t tests and one-way ANOVA for multiple comparisons were used for statistical analysis *p < 0.05.

