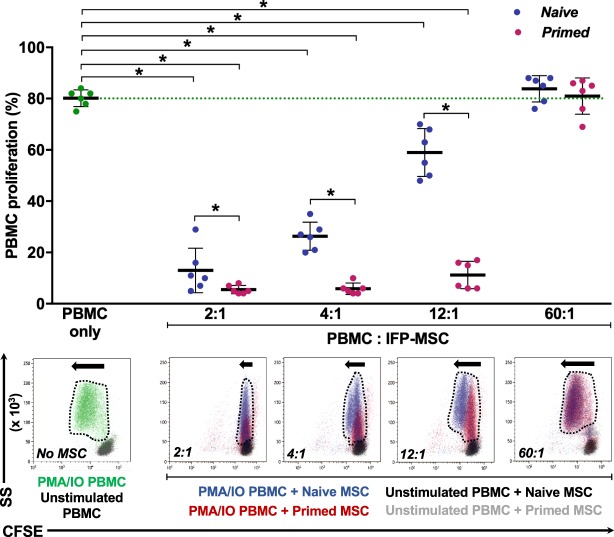
Figure 8.
Immunopotency assay (IPA) with human activated PBMC and IFP-MSC in co-culture. The percentage of CFSE-labelled PMA/IO-activated PBMC proliferation (relative to unstimulated PBMC) was measured in PBMC only and in co-cultures with naïve and TI-primed IFP-MSC at various ratios (2:1, 4:1, 12:1, 60:1 PBMC:IFP-MSC). Naïve IFP-MSC (blue) abrogated PBMC proliferation in a declining dose-dependent manner, while TI-primed cells (red) sustainably affected PBMC proliferation even at a 12:1 ratio. At a 60:1 ratio, the interaction with either IFP-MSC slightly augmented PBMC proliferation. PBMC proliferation is quantified (top), whereas corresponding representative flow cytometry overlay data (bottom) shows proliferation magnitude with dotted line shape and arrow sizes. All co-cultures were performed in duplicate, with every MSC donor (n = 3) co-cultured in independent experiments with two different PBMC populations obtained from unrelated donors. Data are presented as scatter plots with mean ± SD, with 6 data points per conditions (3 MSC ×2 PBMC). Paired and unpaired t tests and one-way ANOVA for multiple comparisons were used for statistical analysis *p < 0.05.

