Fig. 1.
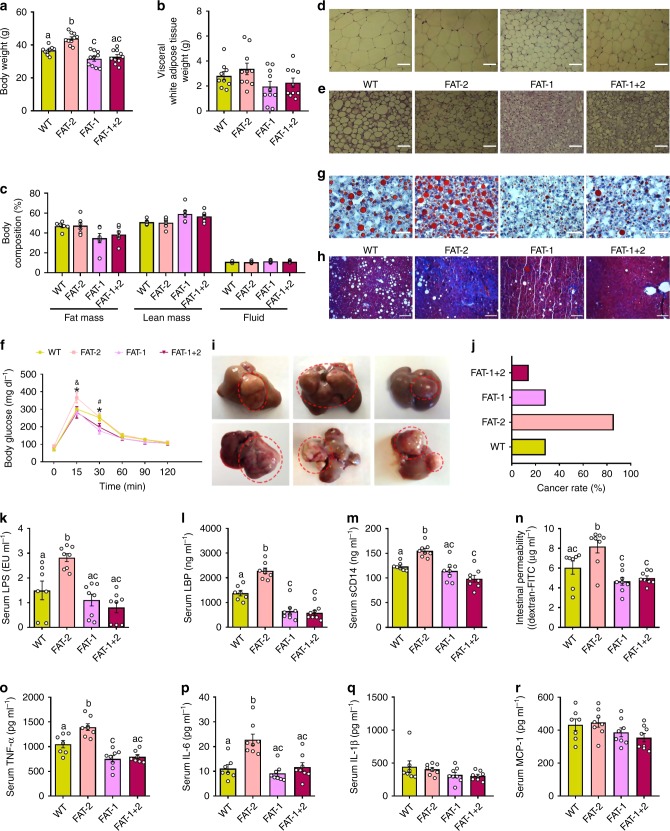
Tissue omega-6/omega-3 PUFA ratio influences the development of metabolic disorders and cancer. Wild type (WT) and FAT-2, FAT-1, and FAT-1+2 transgenic mice fed an identical Western diet for 16 months were subjected to several types of analyses at different time points. a Body weight at the age of 8 months. b Visceral white adipose tissue weight (g) after sacrificing the mice. c Nuclear magnetic resonance technique-based body composition analysis at the age of 16 months. Histopathological analysis (hematoxylin & eosin staining) of subcutaneous white adipose tissue (d) and inter-scapular brown adipose tissue (e) after sacrificing the mice. f Oral glucose tolerance test results obtained at the age of 8 months. g Fatty liver analysis performed on Oil Red O-stained liver specimens after sacrificing the mice. h Masson’s trichrome staining (red, keratin and muscle fibers; blue, collagen; light red or pink, cytoplasm and dark brown to black, cell nuclei) performed on liver specimens to estimate the extent of fibrosis. i Anatomical shape and gross appearance of the livers with tumors from the FAT-2 mice. j Differences in the incidence rate of liver cancer between wild type, FAT-2, FAT-1, and FAT-1+2 mice. Markers of metabolic endotoxemia [lipopolysaccharides (LPS) (k), LPS-binding protein (LBP) (l), soluble CD14 (m) and intestinal permeability (serum levels of FITC-dextran macromolecules) (n)] and chronic low-grade inflammation [tumor necrosis factor-α (TNF-α) (o), interleukin-6 (IL-6) (p), IL-1β (q), and monocyte chemoattractant protein 1 (MCP-1) (r)] measured at the age of 12 months. For c, n = 6 per group. For f, k–n and p–r, wild type (n = 7), FAT-2, FAT-1, and FAT-1+2 (n = 8 per group). For o, wild type (n = 7), FAT-2 and FAT-1 (n = 8 per group), FAT-1+2 (n = 7 per group). For others, wild type (n = 9), FAT-2, FAT-1 and FAT-1+2 (n = 10 per group). Data shown as mean ± standard error of mean. Data with different superscript letters are significantly different (P < 0.05) according to ordinary one-way (a–c, k–m, o–r) or repeated measures two-way ANOVA (f) or Kruskal–Wallis test (n) followed by Tukey’s or Dunn’s multiple comparisons test. *FAT-2 vs. FAT-1 and FAT-2 vs. FAT-1+2; &wild type vs. FAT-2; #wild type vs. FAT-1. Scale bar for images d and e: 1000 µm; g: 2000µm; h: 3000 µm

