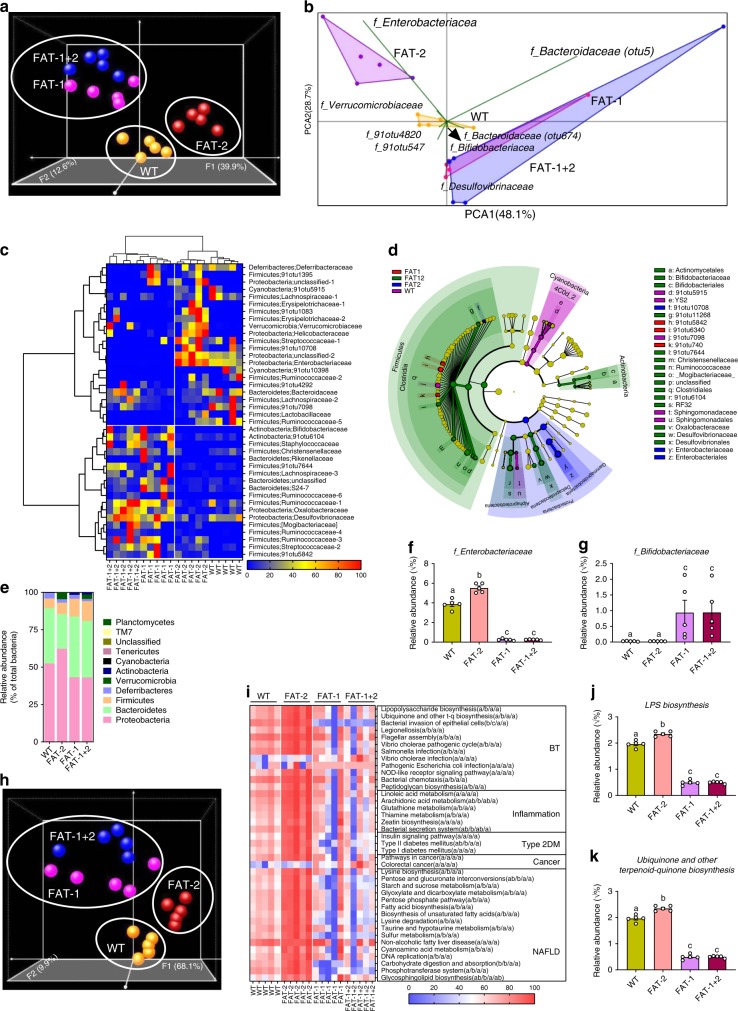
Fig. 2.
Alterations in the tissue-generated omega-6/omega-3 PUFA ratio impact the composition of fecal microbiota. Fecal microbiome analyses (V4 16S rRNA sequencing and predicted microbial functions) were performed on male wild type (WT), FAT-2, FAT-1, and FAT-1+2 transgenic mice (n = 5 per group) fed an identical Western diet for 12 months. a β-Diversity analysis performed on whole microbiota relative abundance using principal coordinate analysis (PCOA) with the Bray–Curtis dissimilarity index (BCD) followed by permutational multivariate analysis of variance (PERMANOVA) significance test. b Similarity percentage analysis with BCD was used to identify the specific genera with the greatest contribution to the differences observed between the groups, followed by principal component analysis (PCA) (variance–covariance type) showing the top eight operational taxonomic unit (OTU) scores included as vectors. The magnitude and direction correspond to the weights. c Hierarchical clustering with a heat map shows the relative abundance of representative OTUs (those with greatest difference between the four genotypes) group means (normalized to %) from each family selected for false discovery rate (FDR) corrected P < 0.05, obtained with differential abundance analysis. The OTUs are shown as phylum and family. d Cladogram generated from linear discriminant analysis (LDA) effect size showing the relationship between taxons (the levels represent, from the inner to outer rings, phylum, class, order, family, and genus). e Analysis at the phylum level using relative abundance (%). f, g Relative abundance (Y = sqrt(Y) transformed) of family_Enterobacteriacea (E) and family_Bifidobacteriacea (%). h Relative abundance of predicted microbial genes related to metabolism was identified using PICRUSt analysis followed by PCOA analysis with BCD and PERMANOVA significance test. i Heat map shows the relative abundance (%) of representative predicted microbial genes (those with greatest difference between four genotypes) group means from each family selected for FDR-corrected P < 0.05, obtained with differential abundance analysis. BT, bacterial translocation; DM, diabetes mellitus; NAFLD, non-alcoholic fatty liver disease. j, k Relative abundance (Y = sqrt (Y) transformed) of predicted bacterial genes involved in LPS biosynthesis and LPS biosynthesis proteins. Data shown as mean ± standard error of mean. n = 5/group. Data with different superscript letters are significantly different (P < 0.05) according to Mann–Whitney test (f, g, j, k)

