Fig. 4.
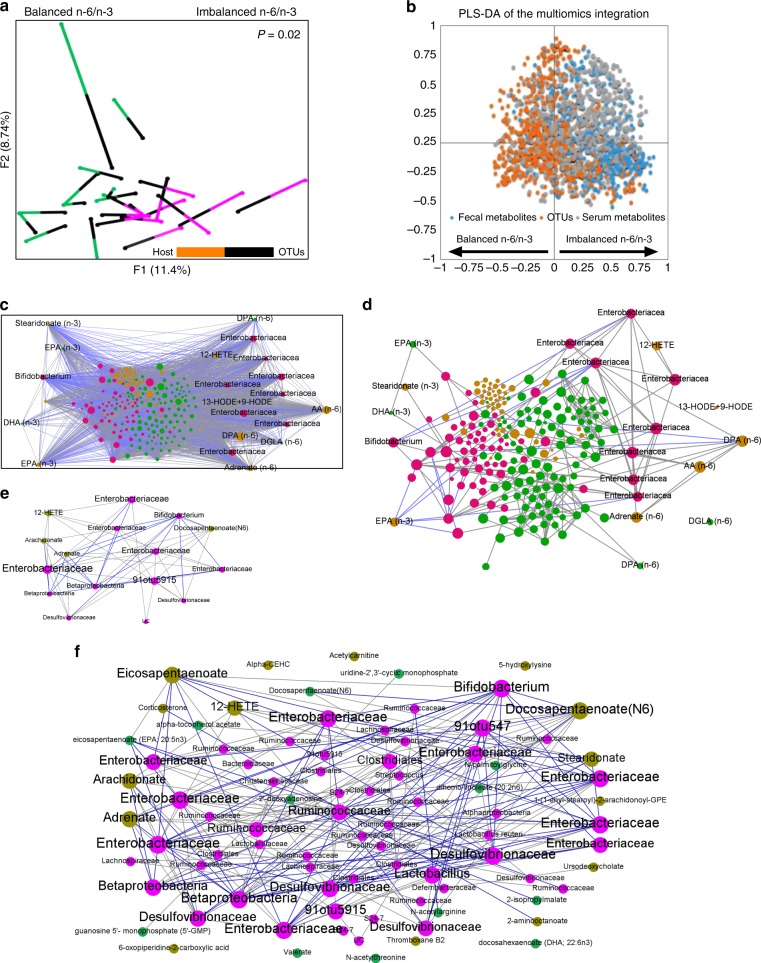
Inter-omic analysis reveals microbe–metabolite interactions between the tissue n-6/n-3 PUFA-associated microbial community type and metabotype. a Multiple factor analysis using Spearman type principal component analysis was performed to superimpose the microbiome (n = 5 per group) and fecal and serum metabolites (n = 6 per group) data (Monte Carlo simulations with a P value equal to 0.02) associated with a balanced n-6/n-3 ratio (FAT-1/FAT-1+2 samples) and an imbalanced n-6/n-3 PUFA ratio (wild type/FAT-2 samples). Each line connects the microbial and metabolomics data from one sample. One end of each connecting line for an observation indicates the metabolites (differently colored to indicate the groups) and another end (black) indicates the microbiota [(operational taxonomic units (OTUs)]. b Multi-omics data integration showing partial leastsquares-discriminant analysis plot of all data (OTUs: 706; fecal metabolites: 554; serum metabolites: 554) for balanced n-6/n-3 (negative x axis) versus imbalanced n-6/n-3 ratio (positive x axis); P = 0.003 (CV-ANOVA); R2X = 0.792; R2Y (cum) = 0.906; Q2 (cum) = 0.837. c–f An inter-omic network was constructed with 225 nodes (filled circles) representing microbes (pink) and fecal (green) and serum (olive) metabolites with FDR-corrected P values <0.05. Node size reflects inter-omic betweeness centrality — a measure of how many shortest paths within the entire network passes through the node in question (crucial to the communication within the network). Names of the selected microbes and metabolites with higher inter-omic degree centrality — the number of connections to nodes of the opposite data type (i.e., microbe–metabolite pairs) were shown. Edges represent statistically significant (spearman’s non-parametric rank correlation coefficient) 5931 positive (gray) and 2403 negative (blue) correlations (P < 0.05) between microbe–microbe, metabolite–metabolite, or microbe–metabolite pairs. The entire network with 8334 edges showing all the correlations with P < 0.05 (c) and the entire network with edges showing only correlations having R value > 0.8 for clarity of the inter-omic network (d). The first (e) and second (f) largest modules (biologically important elementary units of any biological network), which were separated from the full network according to the modularity scores

