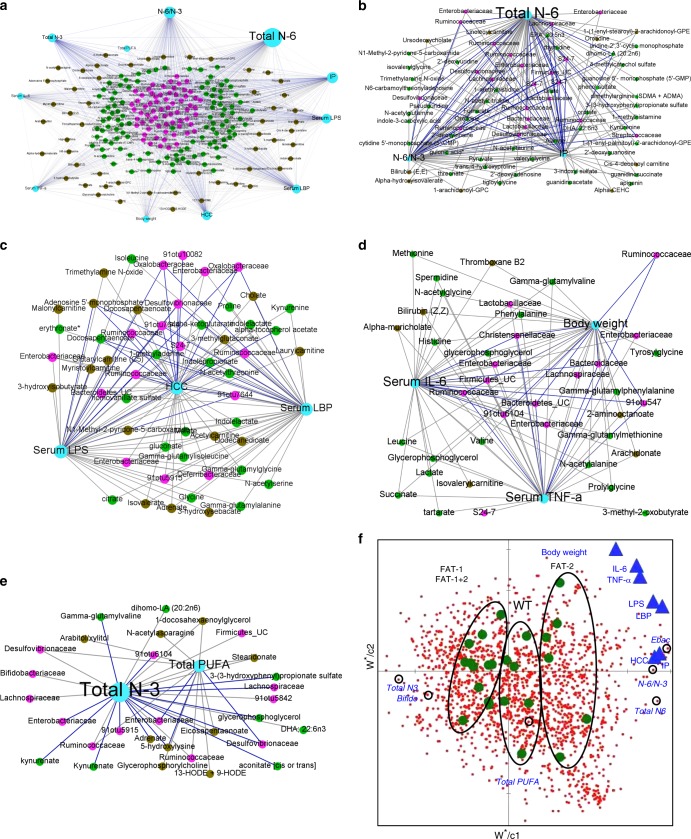
Fig. 5.
Network interactions uncover host–microbiome interactions driven by tissue n-6/n-3 PUFA status. a–e Host–microbiota interaction network built from Spearman’s non-parametric rank correlation coefficient (P < 0.05) between 11 host parameters (serum total PUFA and n-6 and n-3 PUFA, n-6/n-3 ratio, body weight, HCC incidence, IP, serum LPS, LBP, TNF-α and IL-6) (n = 6 per group) and 66 microbial (n = 5 per group) and 159 metabolite parameters (n = 6 per group) with FDR-corrected P values <0.05. Two hundred and thirty-seven nodes (filled circles) represents host parameters (cyan), microbes (pink), fecal (green), and serum (olive) metabolites. Node size reflects betweeness centrality — a measure of how many shortest paths within the entire network passes through the node in question (crucial to the communication within the network). In total, 1089 lines (edges) represent statistically significant correlations (P < 0.05) and are colored gray for 779 positive and blue for 310 negative correlations. The full network (a) with edges showing all the correlations and the four (b–e) largest modules (biologically important elementary units of any biological network), which were separated from the full network according to the modularity scores. f Partial least square (PLS)-regression loading score plot illustrating the association between host parameters (dependent variables — Y; blue triangles) and serum PUFA and microbial and metabolite parameters (explanatory variables — X; red dots). Explanatory variables of interest with variable importance in the projection (VIP) scores >1 were labeled with circles on the red dots. Samples from four different groups (wild type/FAT-2/FAT-1/FAT-1+2) were observed (green dots) and grouped using circles based on where they clustered on the plot. Leave-one-out cross-validation (LOO-CV) was applied. Ebac, Enterobacteriacea; Bifido, Bifidobacteriacea; HCC, hepatocellular carcinoma; IP, intestinal permeability;LPS, lipopolysaccharides; LBP, LPS-binding protein

