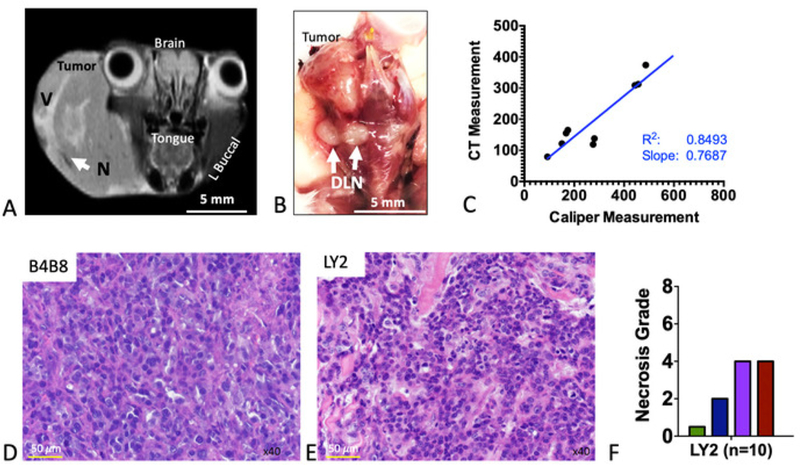
Figure 2: Imaging and histologic features of murine HNSCC tumors.

(A) Representative coronal MR image of an LY2 tumor-bearing mouse. Anatomic sites are labeled. Areas of signal hyperintensity represent vascularized regions (denoted V). Regions of signal hypointensity represent necrotic areas (denote N). (B) Representative gross image of a dissected tumor-containing region. White arrows point to enlarged draining lymph nodes (DLNs). (C) Correlation of tumor volume as assessed by caliper measurement versus computed tomography (CT)-based assessment. Slope, correlation coefficient (R2), and line of best fit are shown. (D) Representative hematoxylin and eosin (H&E) image of LY2 tumor. (E) Representative H&E image of B4B8 tumor. (F) Quantification of necrosis in LY2 tumors, based on an H&E four-grade scoring system.
