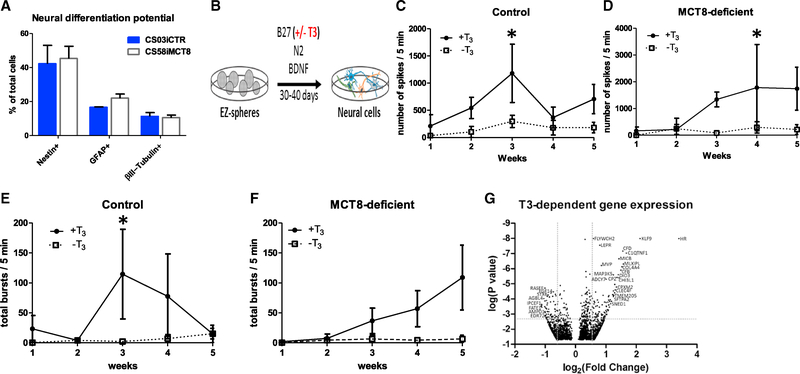
Figure 2. MCT8-Deficient Cells Have Normal Differentiation and T3-Dependent Neuronal Maturation.
(A) Quantifying immunocytochemistry-stained cells showed that MCT8-deficient and control iPSCs had similar neural differentiation potential into Nestin+ progenitor cells, GFAP+ astrocytes and βIII-Tubulin+ neurons. Error bars represent SD.
(B) Scheme for differentiating iPSCs into neural cultures, in the presence or absence of T3 (100 nM) throughout 30–40 days.
(C) Mean of total spikes/5 min in the MCT8 intact (control) CS02iCTR, CS03iCTR and CS01iMCT8cor lines differentiated in the presence of T3 (solid line) was significantly higher than in the absence of T3 (dashed line) (ANOVA, n = 3, p < 0.0384).
(D) Mean of total spikes/5 min in the CS01iMCT8, CS58iMCT8 and CS03iCTRmut MCT8-deficient lines differentiated in the presence of T3 (solid line) was significantly higher than in the absence of T3 (dashed line) (ANOVA, n = 3, p < 0.014).
(E) Mean of total bursts/5 min in the MCT8 intact (control) lines in the presence of T3 (solid line) was significantly higher than in the absence of T3 on the third week of differentiation (t test, n = 3, p < 0.01).
(F) Mean of total bursts/5 min in the MCT8-deficient lines in the presence of T3 (solid line) was not significantly higher than in the absence of T3 (dashed line).
(G) Volcano plot shows differences of expression patterns in healthy control cells in response to T3 treatment. The dotted lines represent 1.5-fold differentially expressed genes by paired Student’s t test followed by Benjamini Hochberg correction for multiple comparisons at a false discovery rate (FDR) of 0.1. See Tables S3 and S4 for complete list.

