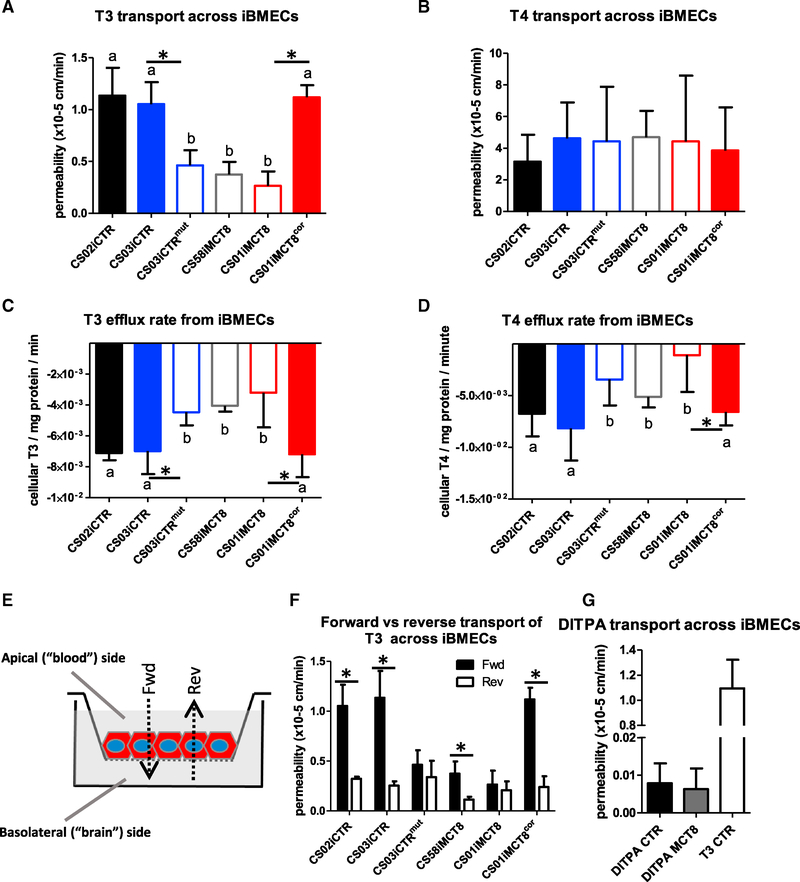
Figure 6. TH Transport across Patient-Derived and Isogenic-Derived iBMECs by LC-MS/MS.
(A) The apical-to-basolateral transport of T3 at 1 nM across MCT8-deficient lines (CS58iMCT8, CS01iMCT8, and CS03CTRmut, denoted by “b”) was significantly lower than in cells containing a functional MCT8 (CS00iCTR, CS03iCTR and CS01iMCT8cor, denoted by “a”) (ANOVA, n = 4, p < 0.0001). Pairwise comparisons showed significant differences between the isogenic lines CS03iCTR and CS03iCTRmut (p < 0.0012) and CS01iMCT8 and CS01iMCT8cor (p < 0.0001).
(B) The apical-to-basolateral transport of T4 at 1 nM across MCT8-deficient lines was not significantly different than transport across cells containing a functional MCT8.
(C) Measuring T3 efflux from iBMECs showed that MCT8-deficient cells (b) displayed significantly lower efflux rates than cells with a functional MCT8 (a) (n = 4, ANOVA, p < 0.0001). Pairwise comparisons showed significant differences between the isogenic lines CS03iCTR and CS03iCTRmut (p < 0.0027), CS01iMCT8 and CS01iMCT8cor (p < 0.0053).
(D) Measuring T4 efflux from iBMECs showed that MCT8-deficient cells (b) displayed significantly lower efflux rates than cells with a functional MCT8 (a) (n = 4, ANOVA, p < 0.001). Pairwise comparisons showed significant differences between the CS01iMCT8 and the CS01iMCT8cor isogenic lines.
(E) Scheme of experimental design. Transport from the apical (blood) side to the basolateral (brain) side corresponds to the forward (Fwd) direction. Reverse (Rev) direction corresponds to the basolateral to apical transport.
(F) Testing the bidirectional transport of 1 nM T3 across iBMECs showed a statistically significant difference between Fwd and Rev directions in functional MCT8 lines (CS02iCTR, p < 0.03; CS03iCTR, p < 0.03; and CS01iMCT8cor, p < 0.0002) and in CS58iMCT8 (p < 0.01). No significant differences were observed across cell lines in the Rev direction.
(G) DITPA (100 nM) transport across iBMECs did not differ between MCT8-deficient and control lines and was ~100-fold lower compared to T3 transport in control lines. Error bars represent SD.

