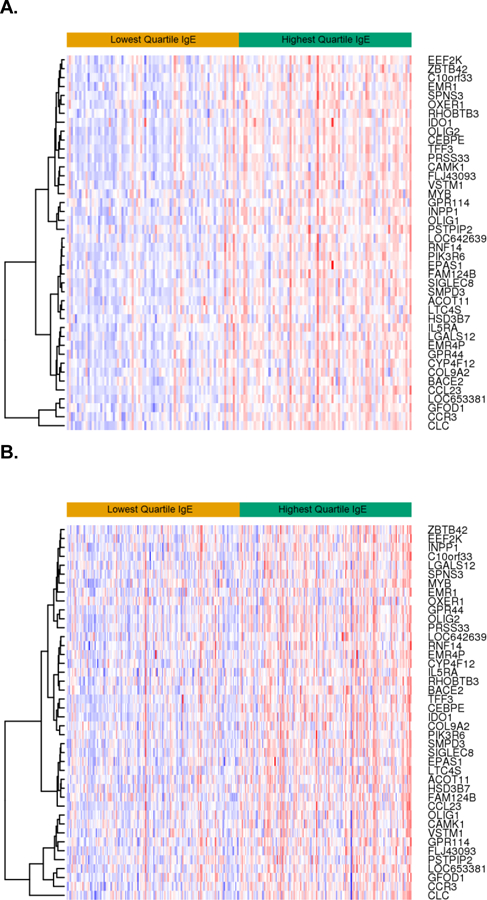
Figure 2: Heatmap comparing differential gene expression of the 42 replicated genes by IgE (top versus bottom quartile) in the (A) GACRS and (B) CAMP populations.

All individuals were included in the differential gene expression analysis; however the top quartile IgE (green) and the bottom quartile IgE (yellow) were displayed for comparison purposes.
