Figure 1:
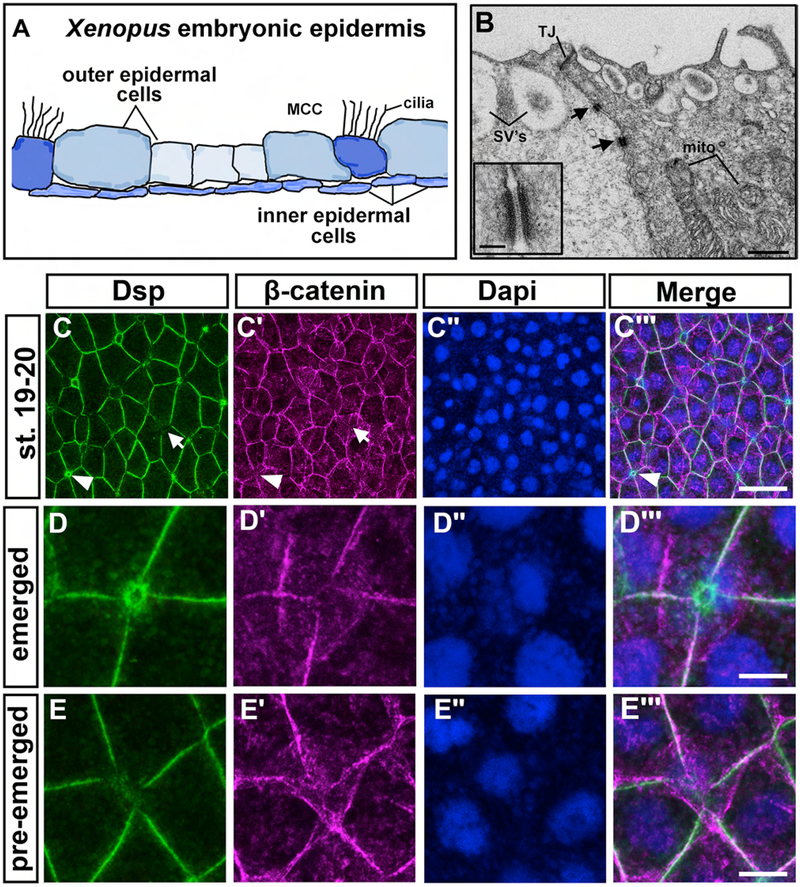
Desmosomes and desmoplakin in the epidermis of X. laevis embryos. A) Schematic showing a transverse section of the X. laevis embryonic epidermis based on actual histological sections. B) TEM images where black arrows indicate desmosomes located between outer epidermal cells. Scale bar=1.8μm. Inset shows higher magnification of a desmosome. Scale bar= 135nm. C-D‴) Immunofluorescence of Dsp and beta-catenin in the epidermis. Dapi labeling of the nuclei was used as a counter stain. C-C‴) st. 19–20, in H arrows indicate regions where there is a less Dsp labeling and arrowheads indicate where there is enrichment of Dsp labeling. The same cells are indicated in panel C’. Scale bar=27μm. D-D‴) High magnification of a cell that appears to be apically emerging with high levels of Dsp and lower beta-catenin. Scale bar = 6μm. D-D‴) High magnification of a cell that appears to be beginning to intercalate and has low levels of Dsp. Scale bar=6μm. Abbreviations= MCC= multiciliated cell, SVs=secretory vesicles, mito=mitochondria, TJ=tight junction, oe=outer epidermis, ie=inner epidermis.

