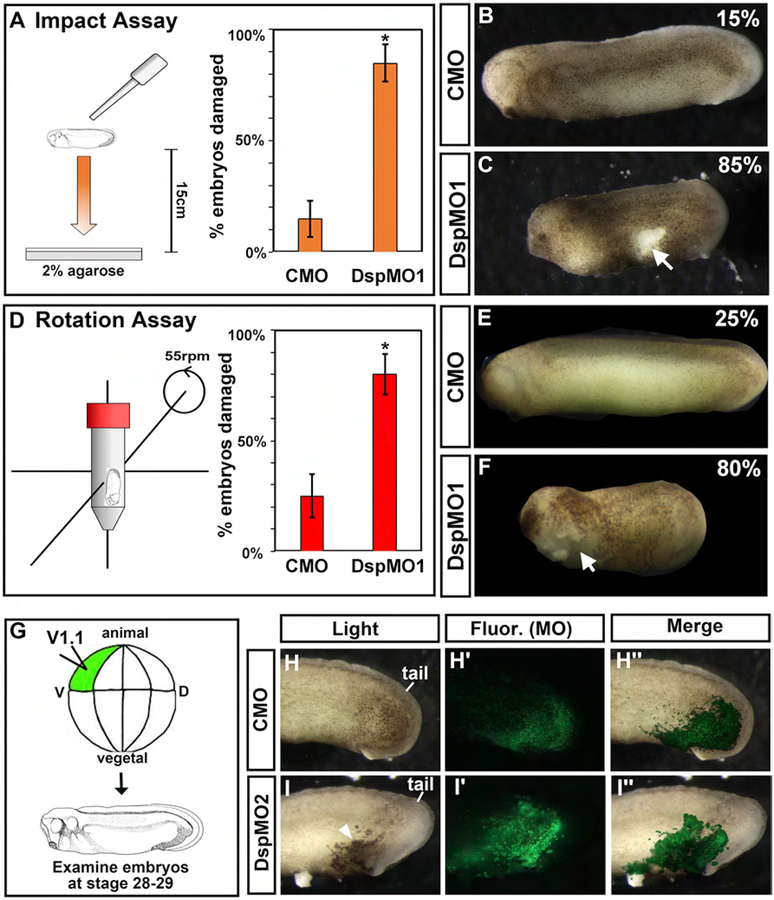
Figure 3:
Decreased Dsp results in less mechanical resilience and is specific to the epidermis. A) Schematic of experimental design for the Dropping Assay. Bar graphs summarizing quantification of the proportion of CMO and DspMO1 morphants with a ruptured epidermis after undergoing the Dropping Assay.*=statistical significance using Chi-Squared test. B-C) Lateral views of a representative control and Dsp morphant at stage 28–30. Anterior is to the left. Arrow indicates regions where the epidermis is broken and arrowheads point to blister like structures. Scale bars=450μm. D) Schematic of experimental design for the Rotation Assay. Bar graphs summarizing quantification of the proportion of CMO and DspMO1 morphants with a ruptured epidermis after undergoing the Rotation Assay. *=statistical significance using Chi-Squared test. E-F) Lateral views of a representative control and Dsp morphant at stage 28–30. Anterior is to the left. Arrow indicates regions where the epidermis is broken and arrowheads point to blister like structures. Scale bars=450μm. G) Schematic of epidermal target injections. H-I‴) Representative lateral views of the posterior of embryos as in G showing the embryo under light (Light), fluorescence (Fluor. MO) to visualize the morpholino alone and merged (Merge). Scale bars=450μm. H-H”) Control MO (CMO) I-I”) DspMO1 morphants.

