Figure 4:
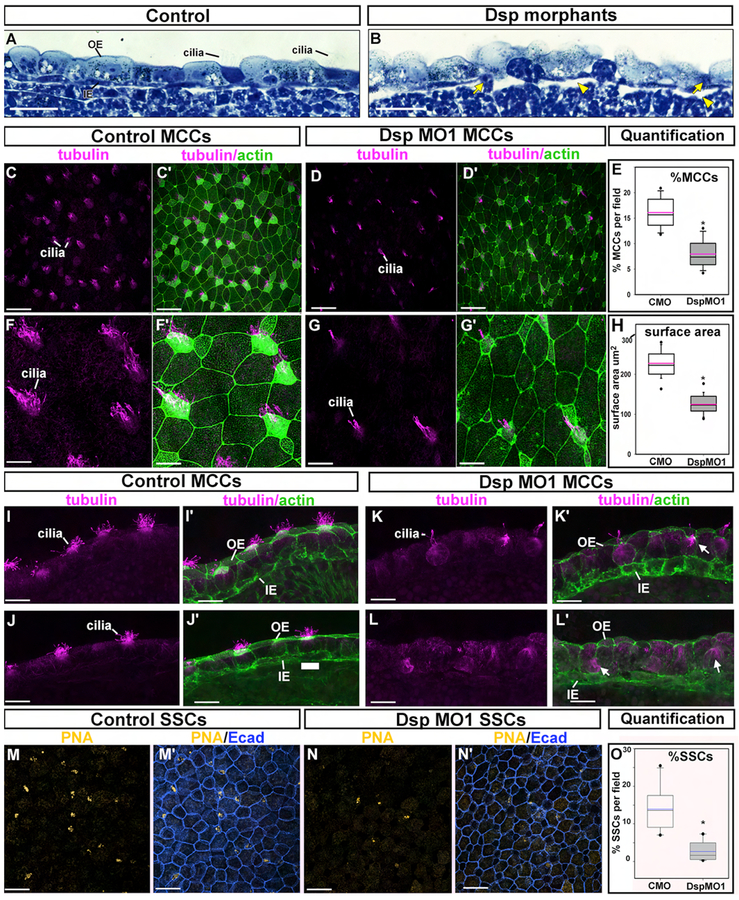
Decreased Desmoplakin results in abnormal epidermal morphology, MCC and SSC development. A-B) Histological sections of the epidermis in control (A) and DspMO1 morphants (B). Yellow arrowheads indicate space underlying the epidermis. Scale bars= 45μm. C-C’) Representative control trunk epidermis labeled with tubulin (C), phalloidin and tubulin (C’). Scale bars = 50μm. D-D’) Representative DspMO1 trunk epidermis labeled with tubulin (D), phalloidin and tubulin (D’). Scale bars = 50μm. E) Quantification of the percentage of tubulin positive cells in control compared to DspMO1 morphants. *=statistical significance. F-F’) Representative control trunk epidermis labeled with tubulin (F), phalloidin and tubulin (F’). 2× magnified region of C and C’. Scale bars =11μm. G-G’) Representative DspMO1 trunk epidermis labeled with tubulin (G), phalloidin and tubulin (G’). 2× magnified region of D and D’. Scale bar =11μm. H) Quantification of the surface area of tubulin positive cells in control compared to DspMO1 morphants. *=statistical significance. I-J’) Sections of two representative control trunk epidermis labeled with tubulin (I,J), phalloidin and tubulin (I’,J’). Scale bars = 22μm. K-L’) Sections of two representative DspMO1 trunk epidermis labeled with tubulin (J), phalloidin and tubulin (G’). Scale bar = 22μm. M-M’) Representative control trunk epidermis labeled with PNA (M), PNA and E-cadherin (M’). Scale bar =50μm. N-N’) Representative DspMO1 trunk epidermis labeled with PNA (N), PNA and E-cadherin (N). Scale bar =50μm. O) Quantification of the percentage of PNA positive cells in control compared to DspMO1 morphants. Blue line represents the mean. *=statistical significance. Abbreviations; PNA-peanut agglutinin, MCC=multiciliated cell, SSC=small secretory cell, OE=outer ectoderm, IE=inner ectoderm.

