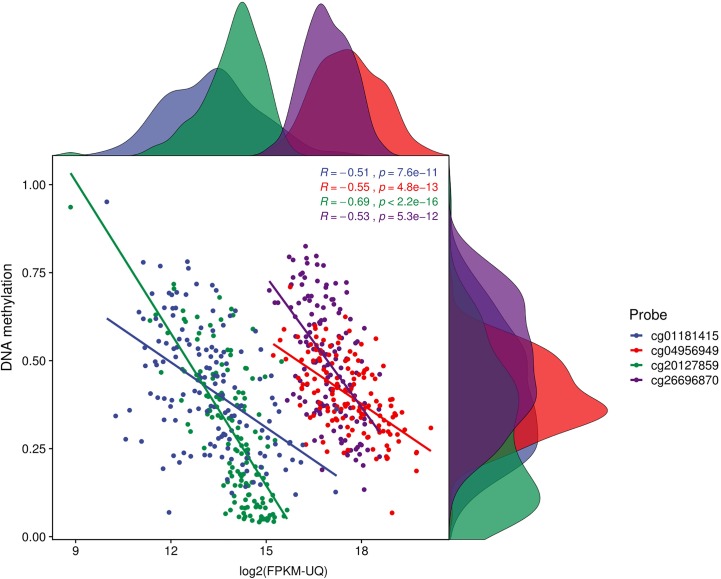
Figure 3.
Correlation plot for survival associated CpGs. We used CpGs which have survival p < = 0.01 and Spearman correlation > 0.5 (p-value < 0.005). This plot is for four promoter CpGs which are negatively correlated with genes expression and also strongly associated with patients’ survival. Distribution of DNA methylation and gene expression in PDAC patients on the right side and top respectively.

