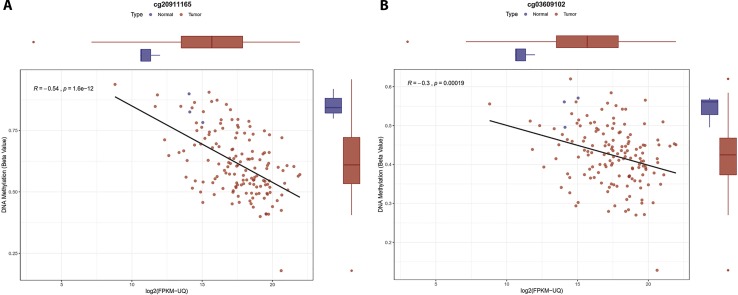
Figure 4.
Correlation plot for the MUC5B promoter methylation sites. Boxplot for gene expression and DNA methylation on top and right side respectively, tumor samples are in red and normal samples in blue color. (A) Correlation plot and boxplot for cg20911165. (B) Correlation plot and boxplot for cg03609102.

