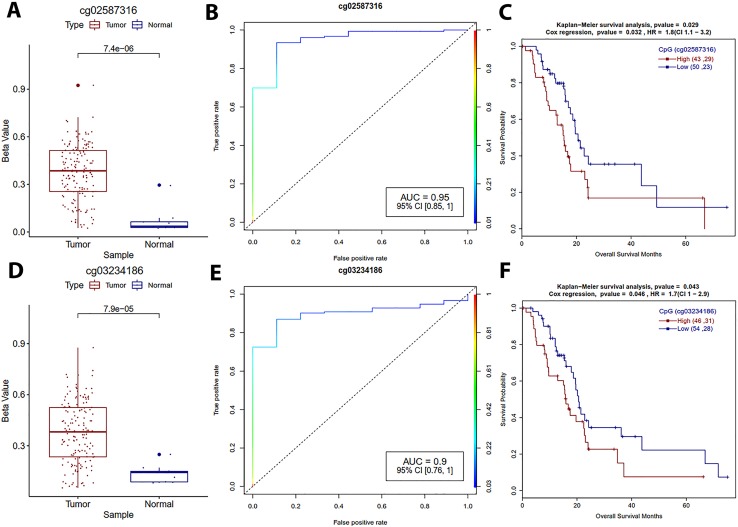
Figure 5.
Survival plots for zinc finger gene promoter DNA methylation sites which are associated with PDAC patients’ survival. (A, D) Boxplot for cg02587316 and cg03234186 DNA methylation distribution for tumor and normal samples with Welch t-test. (B, E) ROC plot for cg02587316 and cg03234186 for the generalized linear model classifier. (C, F) Survival plot for high vs low methylation group for cg02587316 and cg03234186 with a p-value for Kaplan–Meier plot (log-rank test) and Cox proportional hazards model.

