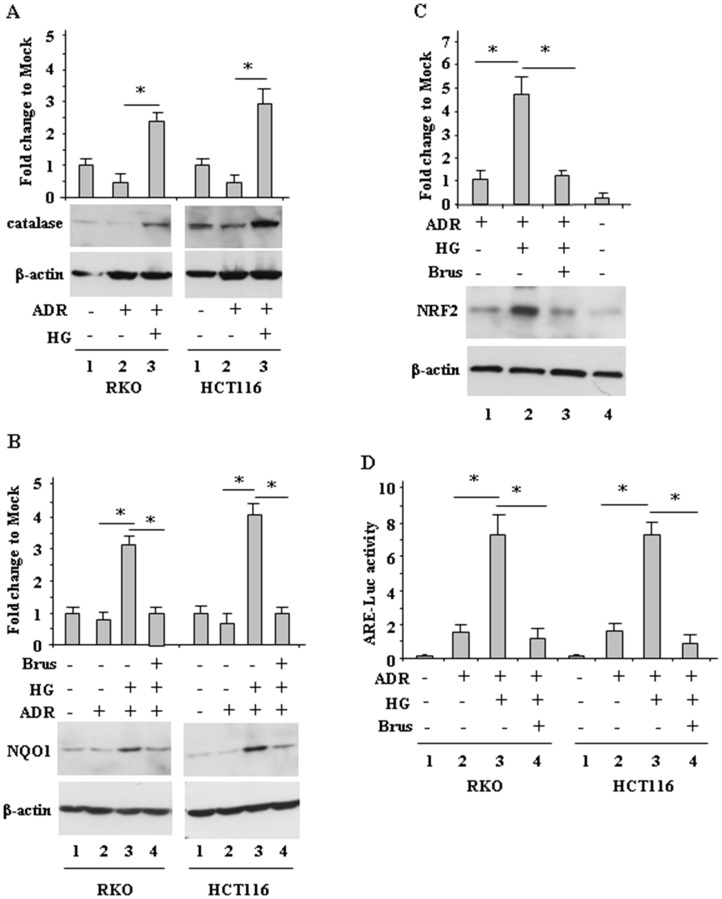
Figure 3. Increased antioxidant response during ADR treatment in HG condition.
(A), RKO and HCT116 cells were treated with ADR (2 μg/ml for 16 h) in low glucose or HG. Equal amount of total cell extracts was analysed by Western immunoblotting with anti-catalase antibody. Representative images are shown. Anti-β-actin was used as protein loading control. Densitometric analysis was applied to quantify catalase expression/β-actin ratio and expressed as fold change to Mock, fixing the control to 1. (B), RKO and HCT116 cells were pre-treated with brusatol (100 nM for 4 h) and then treated with ADR (2 μg/ml for 16 h) in low glucose or HG. Equal amount of total cell extracts was analysed by Western immunoblotting with anti-NQO1 antibody. Representative images are shown. Anti-β-actin was used as protein loading control. Densitometric analysis was applied to quantify NQO1 expression/β-actin ratio is expressed and expressed as fold change to Mock, fixing the control to 1. (C), RKO cells were pre-treated with brusatol (100 nM for 4 h) and then treated with ADR (2 μg/ml for 16 h) in low glucose or HG. Equal amount of total cell extracts was analysed by Western immunoblotting with anti-NRF2 antibody. Representative images are shown (upper panel). Anti-β-actin was used as protein loading control. Densitometric analysis was applied to quantify NRF2 expression/β-actin ratio and expressed as fold change to Mock, fixing the control to 1. (D), RKO and HCT116 cells were transfected with the NRF2 ARE-Luc vector and treated as in (C); then relative luciferase activity was measured. The results of ARE-luc activity are shown as the means ± s.d. of n = 3 independent experiments. ANOVA test with Bonferroni correction: * p < 0.001.

