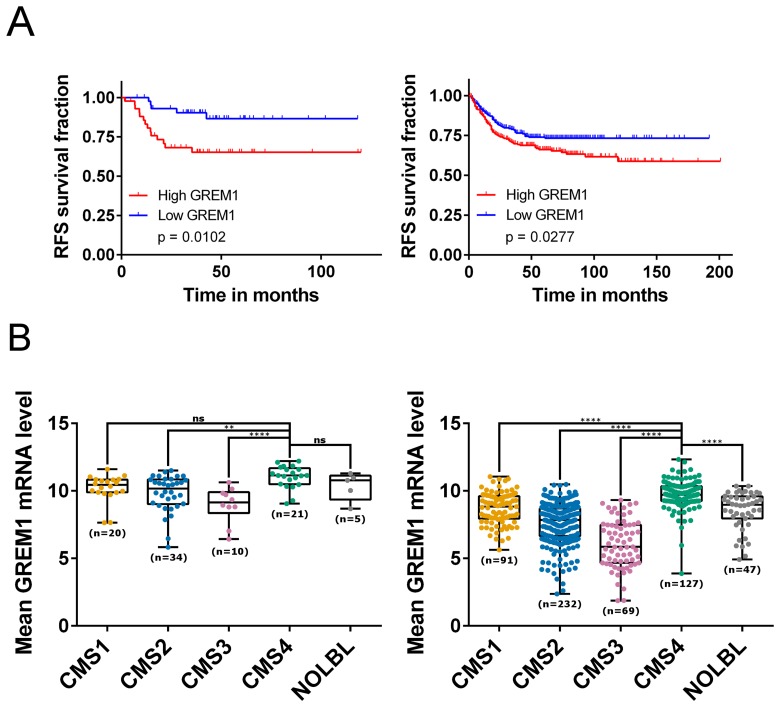
Figure 1. GREM1 mRNA levels correlate with prognosis, CMS subtypes and cancer cell types.
(A) Kaplan-Meier curves for GSE33113 (left; n = 90, 45 patients per group) which contains data from primary tumour resections of stage II CRC patients, and GSE39582 (right; n = 557 (low, n = 279; high, n = 278), which contains primary tumour resections of stage I-IV CRC patients, showing that patients with high expression (above median; red) of GREM1 mRNA have a poorer relapse-free survival compared to those with a low expression (blue; p = 0.0102 and p = 0.0277 respectively). (B) Boxplots showing GREM1 mRNA levels within each of the four CMS subtypes (CMS1-4) together with samples that were unclassified with no CMS label (NOLBL) in GSE33113 (left) and GSE39582 (right). CMS4 patients displayed the highest level of GREM1 mRNA compared to other subtypes (ns non-significant, ** p < 0.01, *** p < 0.001, **** p < 0.0001).

