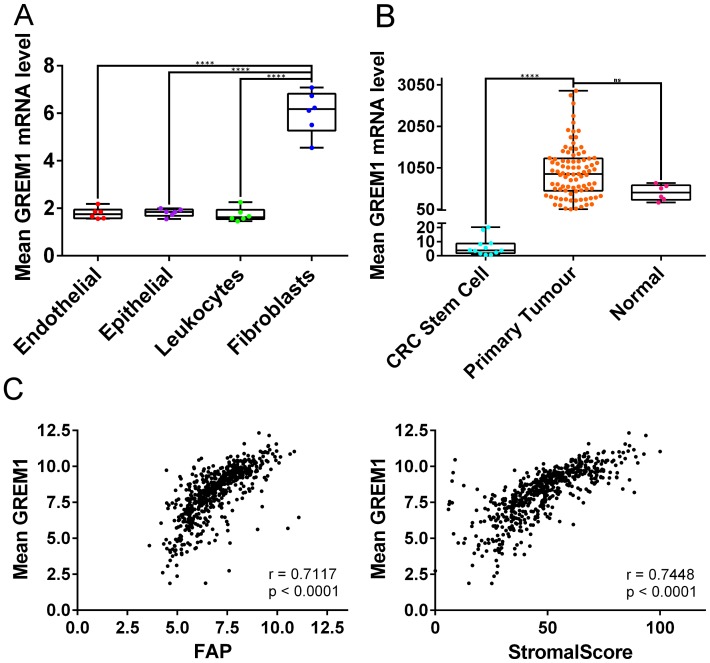
Figure 2. GREM1 mRNA levels in cell populations and tumour tissue, and correlations with FAP expression and StromalScore.
(A) In GSE39396, which contains data from six fresh colon tumours sorted using fluorescence-activated cell sorting (FACS), fibroblasts contain more GREM1 mRNA than endothelial cells, epithelial cells and leukocytes (all p < 0.0001). (B) In GSE33114, GREM1 mRNA levels are significantly higher in primary tumours compared to CRC stem cells (p < 0.0001) and borderline significant compared to normal tissue (p = 0.0744). (ns non-significant, **** p < 0.0001). (C) Scatterplot (left) showing positive correlation between GREM1 mRNA levels and FAP expression in GSE39582 (Pearson r = 0.7117, p < 0.0001). GREM1 mRNA levels also positively correlated with StromalScore (right; Pearson r = 0.7448, p < 0.0001).

