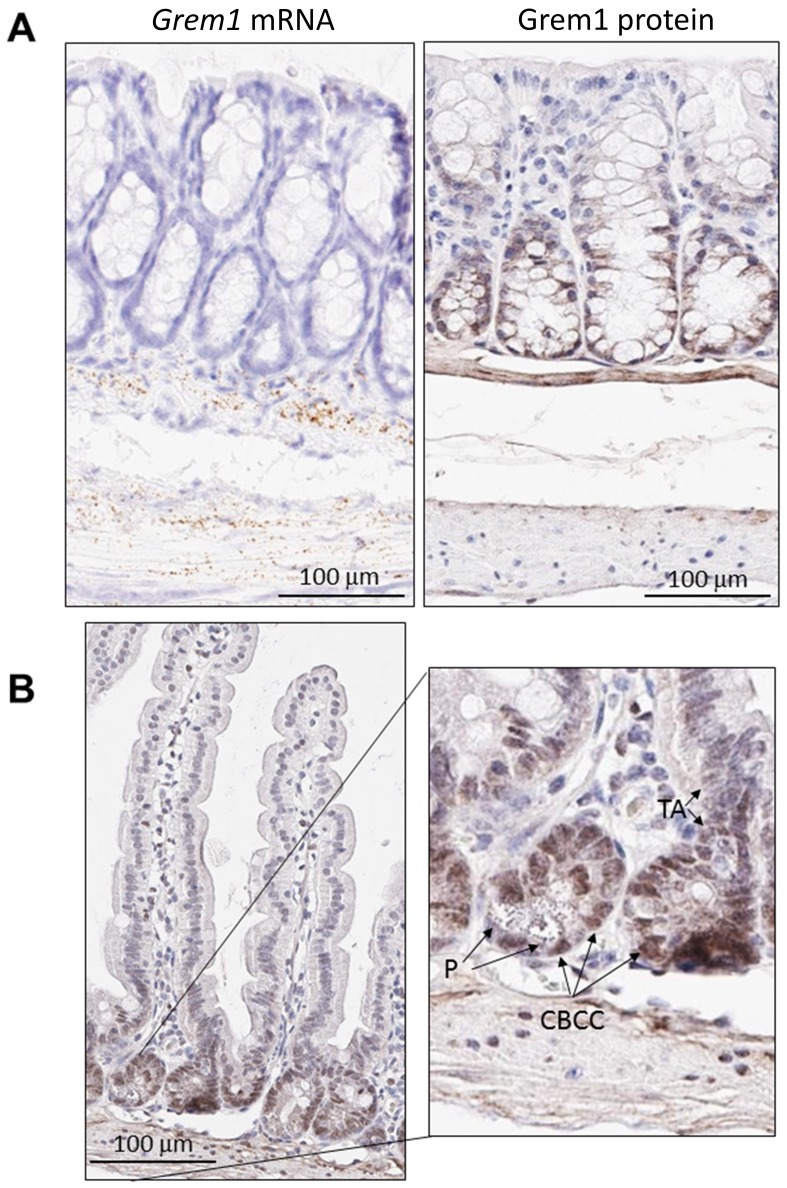
Figure 3. Distinct pattern of endogenous Grem1 expression in mouse colon.
Sections (5 μm) from FFPE colon samples (n = 4) from wild-type or Grem1-/- mice were processed for in situ hybridisation (A left) and immunohistochemistry (A right; B.) as described in Methods. Positive Grem1 mRNA and protein staining was imaged using DAB (brown) and sections were counterstained using haematoxylin and imaged using PathXL. (A) Grem1 mRNA is visible as brown, punctate staining in the muscularis mucosa layer. Scale bars 100 μm. (B) Grem1 protein staining is evident as brown staining in the muscularis layer and the base of the colonic crypts (left; scale bar 100 μm). Grem1 protein staining in the musclaris layer as well as cells of the colonic crypt. CBCC, crypt base columnar cells; P, Paneth cells; TA, transit-amplifying cells.

