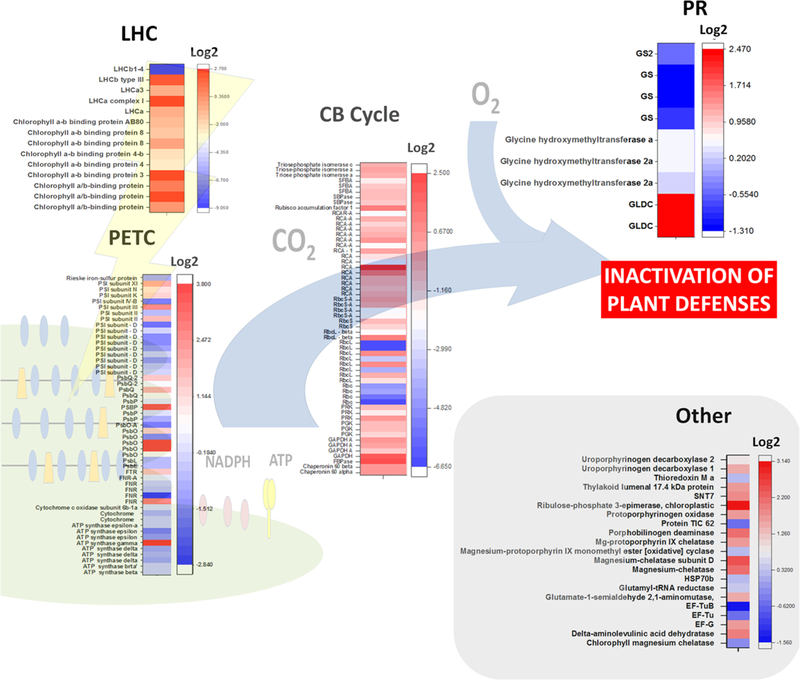
Fig. 4.

Heat map summarizing the changes in abundance of proteins related to photosynthesis and photorespiration in selected virus-infected plants. Proteomics data employed and plant species studied are indicated in Table 2. Changes in protein accumulation are expressed as log2. The heat maps were plotted using the OriginPro 2017 software (Origin Lab Corporation, Northampton, USA). CB Cycle Calvin–Benson cycle, EF-G chloroplastic enlogation factor G, EF-Tu chloro-plastic enlogation factor Tu, FNR ferredoxin-dependent NADP(H) oxireductase, FTR ferredoxin-dependent thioredoxin reductase, GAPDH glyceraldehyde 3-phosphate dehydrogenase, GLDC glycine dehydrogenase (decarboxylating), GS glutamine synthetase, HSP70b chloroplastic heat shock protein 70 b, LHC light harvesting complex, LHCa light harvesting complex from PSI, LHCb light harvesting complex from PSII, PETC photosynthetic electron transport chain, PGK phosphoglycerate kinase, PR photorespiration, PRK phosphoribulokinase, PsbO subunit O from PSII (OEE1), PsbP subunit P from PSII (OEE2), PsbQ subunit Q from PSII (OEE3), PSI photosystem I, PSII photosystem II, RbcL large subunit of Rubisco, RbcS small subunit of Rubisco, RCA Rubisco activase, SBPase sedoheptulose biphosphatase, SFBA sedoheptulose/frutose biphosphate aldolase, SNT7 serine/threonine-protein kinase
