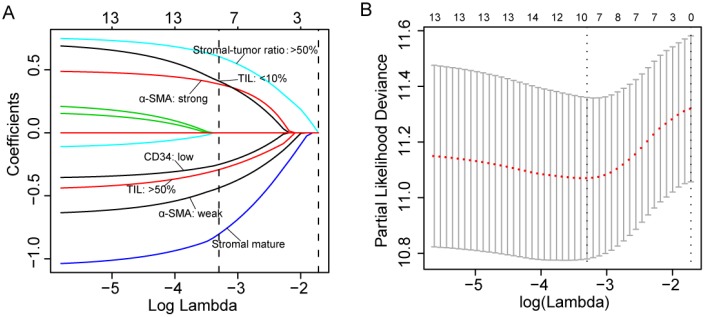
Figure 1.
(A) LASSO coefficient profiles of the five selected stromal features. A dashed vertical line is drawn at the value (logγ=-3.3) chosen by 10-fold cross-validation. (B) Partial likelihood deviance for the LASSO coefficient profiles. A light dashed vertical line stands for the minimum partial likelihood deviance. A dashed vertical line stands for the partial likelihood deviance at the value (logγ=-3.3).

