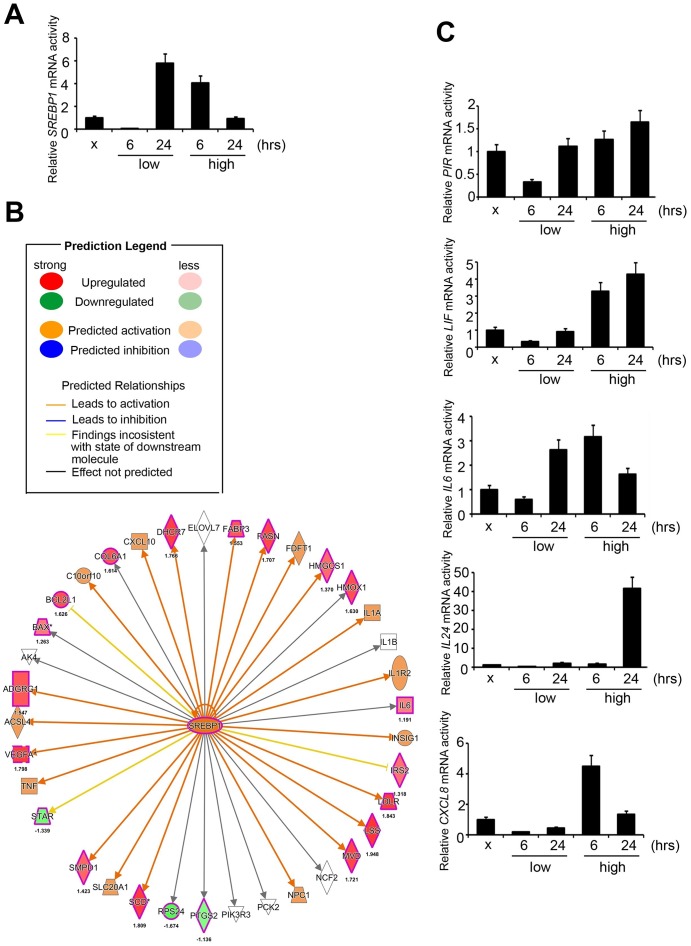
Figure 2.
Signatures regulated by PM in HPF models. (A) The mRNA level of SREBP1 after PM treatment. (B) The prediction of SREBP1-network derived from the common signature, by comparison of IPA database with microarray data from HPF cells with a 1.5-fold-change cut-off. The intensity of the node color indicates the degree of activating (orange) or inhibiting (blue) regulation following PM interaction. (C) Several mRNA levels of SREBP1 downstream factors, including PIR, LIF, IL-6, IL-24, and CXCL8, after PM treatment in HPF.

