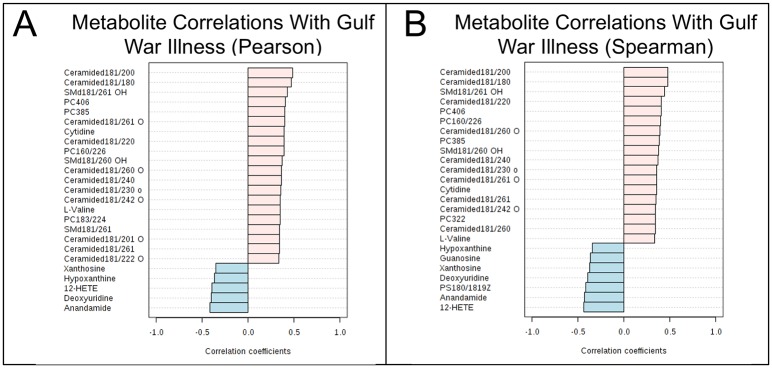
Fig 2. Top 25 metabolites most correlated with Gulf War illness vs healthy civilian controls.
A. Ranked by parametric Pearson r correlation. B. Ranked by non-parametric Spearman rank correlation. Pink bars represent metabolites that were increased in GWI. Blue bars represent metabolites that were decreased in GWI. Pairwise correlations were based on z-scores.

