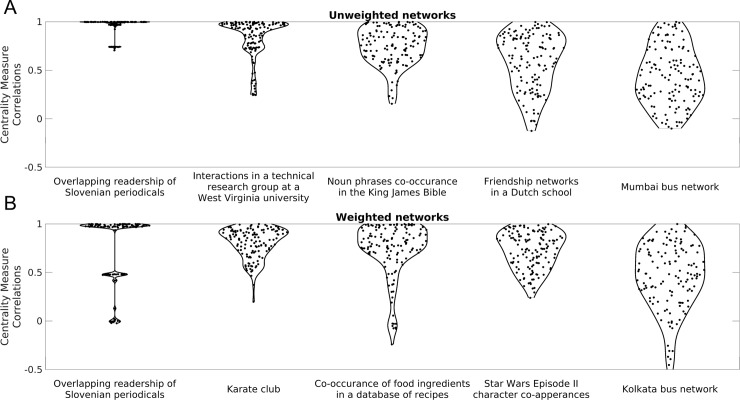
Fig 2. Distributions of Centrality Measure Correlations (CMCs) for example unweighted and weighted networks.
Distributions of CMCs for every pair of centrality measures for five example unweighted (panel A); and weighted networks (panel B). Networks have been ordered from highest (left) to lowest (right) median CMC.

