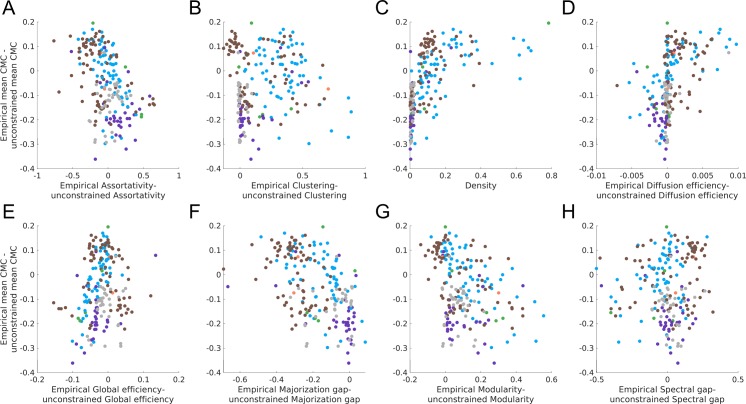
Fig 5. Difference between unweighted empirical and unconstrained surrogates in mean within-network CMC and network properties.
The y-axis of each plot shows the difference between the empirical networks and unconstrained surrogates mean within-network CMC. The x-axis shows the difference between the empirical networks and unconstrained surrogates on a particular property (except for panel C as the unconstrained surrogates have the same density as the empirical network). On both axis, except for the x-axis in panel C, a negative value indicates the empirical network had a lower value than the mean value of the surrogates, while a positive value indicates the empirical networks had a larger value. Points are coloured by the natural category of the empirical network (blue = social, grey = technological, brown = biological, orange = informational, purple = transportation; green = economic).

