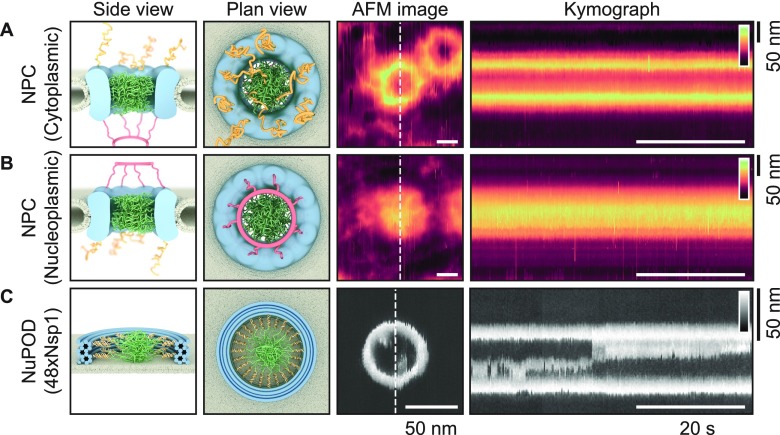
Figure 1.
Producing kymographs from Xenopus laevis oocyte NPCs and from NuPODs. Schematics (side and top views) and representative AFM images of NPCs with the cytoplasmic (A) and nucleoplasmic (B) sides facing the AFM tip and of a DNA-origami-based NPC mimic (“NuPOD”;5 C) that contains 48 Nsp1 proteins, resting on a supported lipid bilayer. The NPC is asymmetrical when viewed through the mirror plane of the nuclear envelope: From the cytoplasmic face, cytoplasmic filaments are seen (yellow filaments), and from the nucleoplasmic face, the nuclear basket protrudes (red filaments). The disordered FG-nups are shown in green (A–C). Kymographs are obtained by recording the same scan line across the pore (white-dashed lines in AFM images) as a function of time (horizontal axis of the kymographs). Note the differences in scale bars between the NPC and NuPOD data. Height scales (insets in kymographs): 80 nm for the NPCs and 20 nm for the NuPOD.

