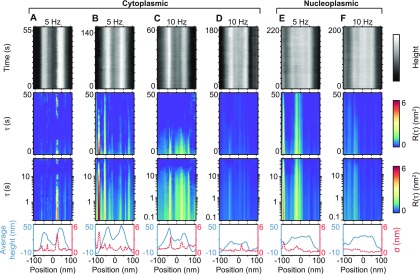
Figure 2.
Kymographs and autocorrelation analysis of NPCs. (A–D) Kymographs of NPCs at the cytoplasmic face (top row), recorded as explained in Figure 1, but with time on the vertical axis (recorded at line frequencies of 5 and 10 Hz). The concomitant autocorrelation factor, R, is displayed as a function of position with respect to the pore center and as a function of time-lag, τ, with τ plotted on linear (second row) and logarithmic (third row) scales. The average height profiles (blue) and respective standard deviations (red) are plotted in the final row. (E and F) Same as for (A–D) but for the nucleoplasmic face of NPCs. Kymograph height scales: 50 nm (A and C), 60 nm (B), 25 nm (D), 40 nm (E and F). (A–D) Data each from different NPCs. (E and F) The same NPC scanned at 5 and 10 Hz.

