Abstract
Internet data are being increasingly integrated into health informatics research and are becoming a useful tool for exploring human behavior. The most popular tool for examining online behavior is Google Trends, an open tool that provides information on trends and the variations of online interest in selected keywords and topics over time. Online search traffic data from Google have been shown to be useful in analyzing human behavior toward health topics and in predicting disease occurrence and outbreaks. Despite the large number of Google Trends studies during the last decade, the literature on the subject lacks a specific methodology framework. This article aims at providing an overview of the tool and data and at presenting the first methodology framework in using Google Trends in infodemiology and infoveillance, including the main factors that need to be taken into account for a strong methodology base. We provide a step-by-step guide for the methodology that needs to be followed when using Google Trends and the essential aspects required for valid results in this line of research. At first, an overview of the tool and the data are presented, followed by an analysis of the key methodological points for ensuring the validity of the results, which include selecting the appropriate keyword(s), region(s), period, and category. Overall, this article presents and analyzes the key points that need to be considered to achieve a strong methodological basis for using Google Trends data, which is crucial for ensuring the value and validity of the results, as the analysis of online queries is extensively integrated in health research in the big data era.
Keywords: big data, health, infodemiology, infoveillance, internet behavior, Google Trends
Introduction
The use of internet data has become an integral part of health informatics over the past decade, with online sources becoming increasingly available and providing data that can be useful in analyzing and predicting human behavior. This use of the internet has formed two new concepts: “Infodemiology,” first defined by Eysenbach as “the science of distribution and determinants of information in an electronic medium, specifically the Internet, or in a population, with the ultimate aim to inform public health and public policy” [1], and “Infoveillance,” defined as “the longitudinal tracking of infodemiology metrics for surveillance and trend analysis” [2].
The main limitation of validating this line of research is the general lack of openness and availability of official health data. Data collection and analysis of official health data on disease occurrence and prevalence involve several health officials and can even take years until the relevant data are available. This means that data cannot be accessed in real time, which is crucial in health assessment. In several countries, official health data are not publicly available, and even in countries where data are available, they usually consist of large time-interval data (eg, annual data), which makes the analysis and forecasting of diseases and outbreaks more difficult.
Nevertheless, data from several online sources are being widely used to monitor disease outbreaks and occurrence, mainly from Google [3-7] and social media [8-12]. Twitter has become increasingly popular over the past few years [13-19], while several other studies have combined data from different online sources such as Facebook and Twitter [20] or Google, Twitter, and electronic health records [21].
Currently, the most popular tool in addressing health issues and topics with the use of internet data is Google Trends [22], an open online tool that provides both real-time and archived information on Google queries from 2004 on. The main advantage of Google Trends is that it uses the revealed and not stated users’ preferences [23]; therefore, we can obtain information that would be otherwise difficult or impossible to collect. In addition, as data are available in real time, it solves issues that arise with traditional, time-consuming survey methods. Another advantage is that, as Web searches are performed anonymously, it enables the analysis and forecasting of sensitive diseases and topics, such as AIDS [24], mental illnesses and suicide [25-27], and illegal drugs [28,29].
Despite the limitations of data from traditional sources and owing to the fact that online data have shown to be valuable in predictions, the combination of traditional data and Web-based data should be explored, as the results could provide valid and interesting results. Over the past few years, the diversity of online sources used in addressing infodemiology topics is increasing. Indicative recent publications of online sources and combinations of sources are presented in Table 1.
Table 1.
Recent indicative infodemiology studies.
| Author(s) | Keywords | Google Trends | Other social media (eg, YouTube) | Blogs, forums, news outlets, Wikipedia | Databases, electronic health records | Other search engines (Baidu) | ||
| Abdellaoui et al [30] | Drug treatment |
|
|
|
|
✓ |
|
|
| Allen et al [31] | Tobacco waterpipe |
|
✓ |
|
|
|
|
|
| Berlinger et al [32] | Herpes, Vaccination | ✓ |
|
|
|
|
|
|
| Bragazzi and Mahroum [33] | Plague, Madagascar | ✓ |
|
|
|
|
|
|
| Chen et al [18] | Zika epidemic |
|
✓ |
|
|
|
|
|
| Forounghi et al [34] | Cancer | ✓ |
|
|
|
|
|
|
| Gianfredi et al [35] | Pertussis | ✓ |
|
|
|
|
|
|
| Hswen et al [36] | Psychological analysis, Autism |
|
✓ |
|
|
|
|
|
| Jones et al [37] | Cancer |
|
|
|
|
✓ |
|
|
| Kandula et al [38] | Influenza | ✓ |
|
|
|
|
|
|
| Keller et al [39] | Bowel disease, Pregnancy, Medication |
|
|
✓ | ✓ | ✓ |
|
|
| Mavragani et al [7] | Asthma | ✓ |
|
|
|
|
|
|
| Mejova et al [40] | Health monitoring |
|
|
✓ |
|
|
|
|
| Odlum et al [41] | HIV/AIDS |
|
✓ |
|
|
|
|
|
| Phillips et al [42] | Cancer | ✓ |
|
|
|
|
|
|
| Poirier et al [43] | Influenza, Hospitals | ✓ |
|
|
|
|
✓ |
|
| Radin et al [44] | Systematic Lupus Erythematous | ✓ |
|
|
|
|
|
|
| Roccetti et al [20] | Crohn’s disease |
|
✓ | ✓ |
|
|
|
|
| Tana et al [25] | Depression, Finland | ✓ |
|
|
|
|
|
|
| Vsconcellos-Silva et al [45] | Cancer | ✓ |
|
|
|
|
|
|
| Wakamiya et al [46] | Influenza |
|
✓ |
|
|
|
|
|
| Wang et al [47] | Obesity | ✓ |
|
|
|
|
|
|
| Watad et al [48] | West Nile Virus | ✓ |
|
|
✓ | ✓ |
|
|
| Xu et al [49] | Cancer, China |
|
|
|
|
|
|
✓ |
As discussed above, many studies have used Google Trends data to analyze online behavior toward health topics and to forecast prevalence of diseases. However, the literature lacks a methodology framework that provides a concise overview and detailed guidance for future researchers. We believe such a framework is imperative, as the analysis of online data is based on empirical relationships, and thus, a solid methodological basis of any Google Trends study is crucial for ensuring the value and validity of the results.
We proceed in a step-by-step manner to develop the methodology framework that should be followed when using Google Trends in infodemiology. First, we provide an overview of how the data are retrieved and adjusted along with the available features, followed by the methodology framework for choosing the appropriate keyword(s), region(s), period, and category. Finally, the results are discussed, along with the limitations of the tool and suggestions for future research.
Methodology Framework
Data Overview
Google Trends is an open online tool that provides information on what was and is trending, based on actual users’ Google queries. It offers a variety of choices, such as Trending Searches, Year in Search, and Explore. Table 2 describes the features offered by Google Trends and their respective descriptions.
Table 2.
Google Trends Features and Descriptions.
| Feature | Description |
| Homepage | Provides an overview of what is searched for in a selected region (default: United States) |
| Explore | Allows exploration of the online interest for specific keywords over selected periods and regions (default: worldwide, 12 months) |
| Trending Searches | Shows the trending queries for (1) daily search trends and (2) real-time search trends in a selected region (default: United States) |
| Year in Searches | Show what was trending in a specific region in a specific year (default: United States, previous year) |
| Subscriptions | Allows subscription for (1) a specific topic in a specific region and sends updates for noteworthy events (via email either once a week or once a month) and (2) trending searches and sends updates about trending searches (via email either as it happens, or once a day, or once a week and includes either “Top Daily Searches,” “Majority of Daily Search Trends,” or “All Daily Search Trends”) |
When using Google Trends for research, data are retrieved from the “Explore” feature, which allows download of real-time data from the last week and archived data for specific keywords and topics from January 2004 up to 36 hours before the search is conducted. The data are retrieved directly from the Google Trends Explore page in .csv format after the examined keyword(s) is entered and the region, period, and category are selected. By default, the period is set to “Worldwide,” the time frame is set to “past 12 months,” and the category is set to “All categories.”
The data are normalized over the selected time frame, and the adjustment is reported by Google as follows:
Search results are proportionate to the time and location of a query by the following process: Each data point is divided by the total searches of the geography and time range it represents to compare relative popularity. Otherwise, places with the most search volume would always be ranked highest. The resulting numbers are then scaled on a range of 0 to 100 based on a topic’s proportion to all searches on all topics. Different regions that show the same search interest for a term don't always have the same total search volumes [50]
The normalization of data indicates that the values vary from 0 to 100. The value 0 does not necessarily indicate no searches, but rather indicates very low search volumes that are not included in the results. The adjustment process also excludes queries that are made over a short time frame from the same internet protocol address and queries that contain special characters. Google does not have a filter for controversial topics, but it excludes related search terms that are sexual. However, it allows retrieval of queries’ normalized hits for any keyword entered, independent of filters.
Google Trends allows one to explore the online interest in one term or the comparison of the online interest for up to five terms. It allows a variety of combinations to compare different terms and regions as follows:
For one term in one region over a specific period, such as for “Asthma” in the United States from January 2004 to December 2014 (Figure 1a)
For the same term in different regions over the same period, such as for “Tuberculosis” in the United States and United Kingdom from March 24, 2007, to April 7, 2011 (Figure 1b)
For different terms (up to five) in the same region for the same period, such as for the terms “Chlamydia,” “Tuberculosis,” and “Syphilis” in Australia from October 5, 2012, to December 18, 2012 (Figure 1c)
For different terms (up to five) for different regions over the same period, such as comparing the term “Asthma” in the United States, “AIDS” in the United Kingdom, and “Measles” in Canada from June 1, 2017, to July 15, 2018 (Figure 1d)
Figure 1.
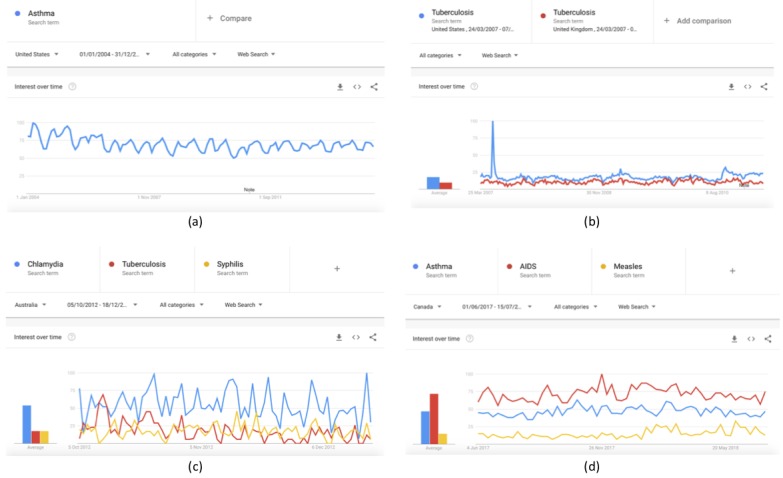
Graphs of the variations in the online interest for the examined terms over the selected time frame in Google Trends.
When the term(s), region(s), period(s), and category are defined, the outputs are a graph of the variations of all examined terms in the online interest over the selected time frame (Figure 1) and their respective heat maps, which are presented separately for all examined regions (Figure 2); all datasets can be downloaded in .csv format.
Figure 2.
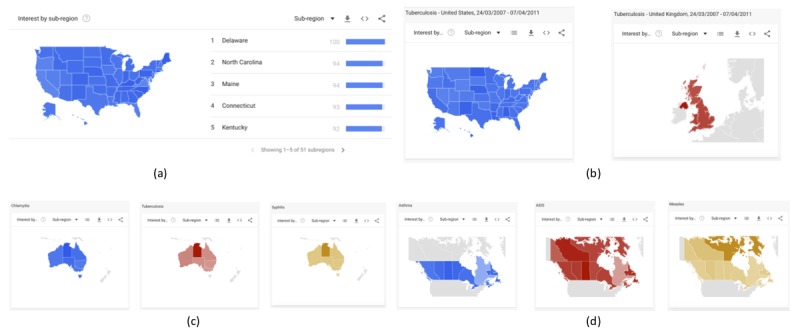
Heat map for (a) “Asthma” in the United States from Jan 2004 to Dec 2014; (b) “Tuberculosis” in the United States and United Kingdom from March 24, 2007, to April 7, 2011; (c) “Chlamydia,” “Tuberculosis,” and “Syphilis” in Australia from Oct 5, 2012, to Dec 18, 2012; (d) “Asthma” in the United States, “AIDS” in the United Kingdom, and “Measles” in Canada from June 1, 2017, to July 15, 2018.
Apart from the graph, the .csv with the relative search volumes, and the interest heat maps, Google Trends also shows and allows one to download .csv files of (1) the “Top related queries”, defined as “Top searches are terms that are most frequently searched with the term you entered in the same search session, within the chosen category, country, or region” (Figure 3a); (2) the “Rising related queries”, defined as "terms that were searched for with the keyword you entered...which had the most significant growth in volume in the requested time period” (Figure 3b); (3) the “Top Related Topics” (Figure 3c); and (4) the “Rising Related Topics” (Figure 3d).
Figure 3.
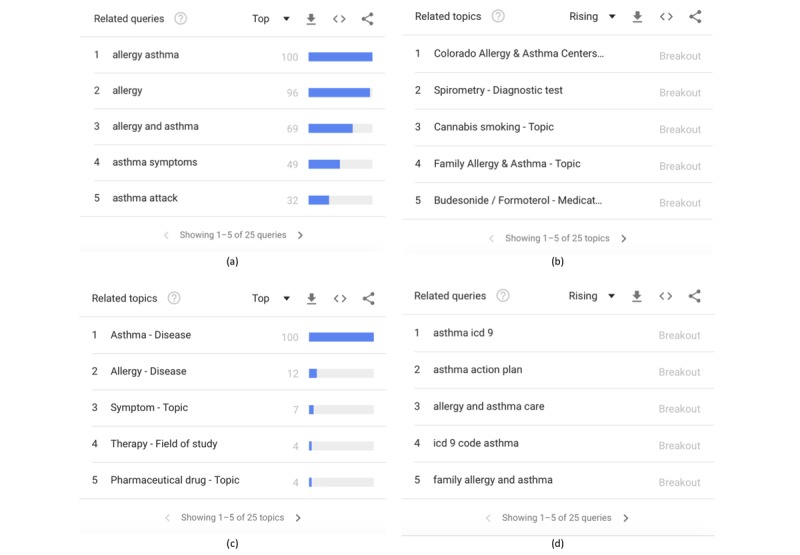
Google Trends’ (a) top related queries, (b) rising related topics, (c) top related topics, and (d) rising related queries for “Asthma” in the United States from Jan 1, 2004, to Dec 31, 2014.
Keyword Selection
The selection of the correct keyword(s) when examining online queries is key for valid results [51]. Thus, many factors should be taken into consideration when using Google Trends data in order to ensure a valid analysis.
Google Trends is not case sensitive, but it takes into account accents, plural or singular forms, and spelling mistakes. Therefore, whatever the choice of keywords or combination of keywords, parts of the respective queries will not be considered for further analysis.
To partly overcome this limitation, the “+” feature can be used to include the most commonly encountered misspellings, which are selected and entered manually; however, we should keep in mind that some results will always be missing, as all possible spelling variations cannot be included. In addition, incorrect spellings of some words could be used even more often than the correct one, in which case, the analysis will not be trivial. However, in most of the cases, the correct spelling is the most commonly used, and therefore, the analysis can proceed as usual. For example, gonorrhea is often misspelled, mainly as “Gonorrea,” which is also the Spanish term for the disease. As depicted in Figure 4a, both terms have significantly high volumes. Therefore, to include more results, both terms could be entered as the search term by using the “+” feature (Figure 4b). In this way, all results including the correct and the incorrect spellings are aggregated in the results. Note that this is not limited to only two terms; the “+” feature can be used for multiple keywords or for results in multiple languages in a region.
Figure 4.
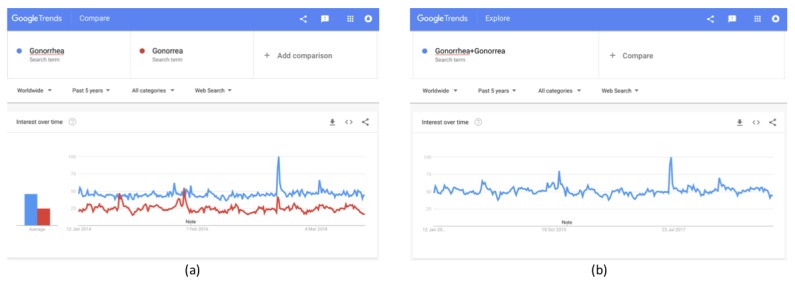
Use of the “+” feature for including misspelled terms for (a) "Gonorrhea" compared to "Gonorrea"; (b) both terms by using the “+” feature.
In the case of accents, before choosing the keywords to be examined, the variations in interest between the terms with and those without accents and special characters should be explored. For example, measles translates into “Sarampión,” “ošpice,” “mässling,” and “Ιλαρά” in Spanish, Slovenian, Swedish, and Greek, respectively. As depicted in Figure 5, in Spanish and Greek, the term without the accent is searched for in higher volumes; in Slovenian, the term with the accent is mostly used; and in Swedish, the term without the accent is almost nonexistent. Thus, in Greek searches, the term without accent should be selected, in Slovenian and Swedish searches, terms with accents should be used, while for Spanish, as both terms yield significant results, either both terms using the “+” feature or the term without the accent should be selected.
Figure 5.
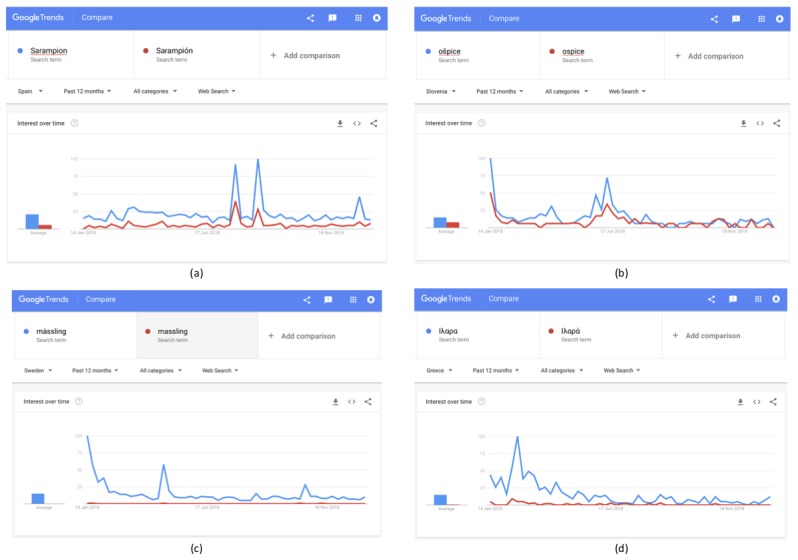
Selection of the correct keyword for measles based on the use of accents in the respective translated terms in (a) Spanish, (b) Slovenian, (c) Swedish, and (d) Greek.
Another important aspect is the use of quotation marks when selecting the keyword. This obviously applies only to keywords with two or more words. For example, breast cancer can be searched online by using or not using quotes. To elaborate, the term “breast cancer” without quotes will yield results that include the words “breast” and “cancer” in any possible combination and order; for example, keywords “breast cancer screening” and “breast and colon cancer” are both included in the results. However, when using quotes, the term “breast cancer” is included as is; for example, “breast cancer screening,” “living with breast cancer,” and “breast cancer patient.” As shown in Figure 6a, the results are almost identical in this case. However, this is not always the case. As depicted in Figure 6b, this is clearly different for “HIV test.” When searching for HIV test with and without quotes, the results differ in volumes of searches, despite the trend being very similar but not exactly the same.
Figure 6.
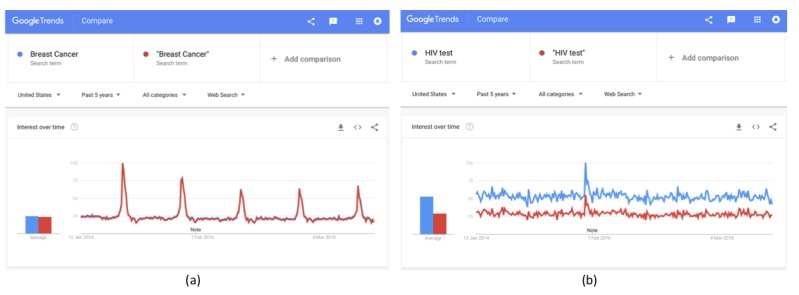
Differences in results with and without quotation marks for (a) “Breast Cancer” and (b) “HIV test.”.
Finally, when researching with Google Trends, the options of “search term” and “disease” (or “topic”) are available when entering a keyword. Although the “search term” gives results for all keywords that include the selected term, “disease” includes various keywords that fall within the category, or, as Google describes it, “topics are a group of terms that share the same concept in any language.”
Therefore, it is imperative that keyword selection is conducted with caution and that the available options and features are carefully explored and analyzed. This will ensure validity of the results.
Region Selection
The next step is to select the geographical region for which query data are retrieved. The first level of categorization allows data download for the online interest of one or more terms worldwide or by country. The list available includes all countries, in most of which interest in smaller regions can be explored.
For example, in the United States, it is possible to compare results even at metropolitan and city levels. Figure 7a shows the regional online interest in the term “Flu” worldwide, where the United States is the country with the highest online interest in the examined term, followed by the rest of the 33 countries in which the examined term is most popular. Figure 7b shows the heat map of the interest by state in the United States in the term “Flu” over the past 5 years; either as a new independent search or by clicking on the country “USA” in the worldwide map. As shown in the right bottom corner of Figure 7, Google Trends provides the relative interest for all 50 US states plus Washington DC.
Figure 7.

Online interest in the term “Flu” over the past 5 years (a) worldwide and (b) in the United States.
In the case of the United States, it is possible to examine the online interest by metropolitan area, as depicted in Figure 8 with the examples of California, Texas, New York, and Florida. The option for examining the online interest at the metropolitan level is not available for all countries, where from the state (or county) level, the interest changes directly to the city level. This includes fewer cities than regions with available metropolitan area data, as, for example, in countries with very large populations like India (Figure 9e) or with smaller populations like Greece (Figure 9f).
Figure 8.
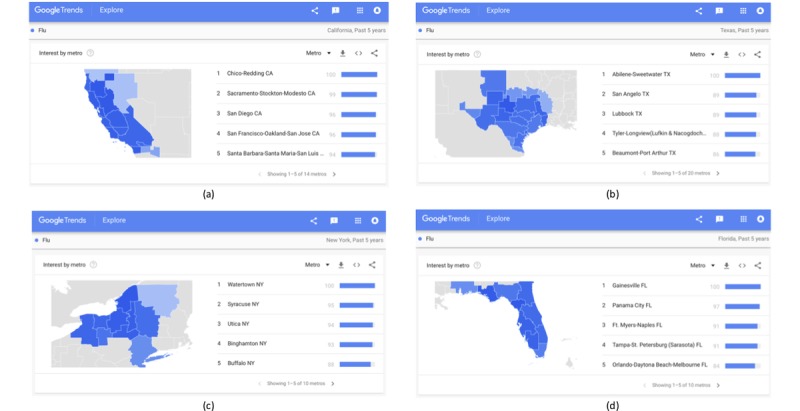
Regional online interest in the term “Flu” at metropolitan level over the past 5 years in (a) California, (b) Texas, (c) New York, and (d) Florida.
Figure 9.
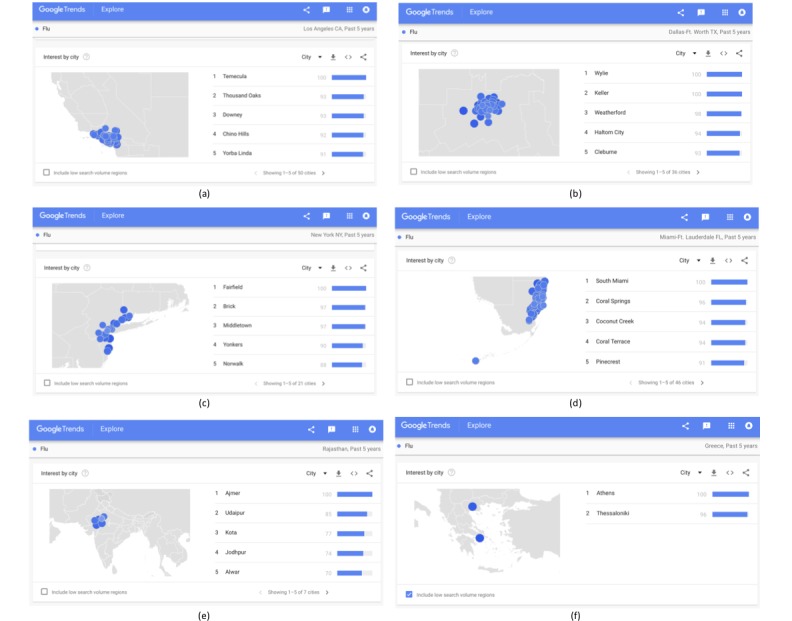
Regional online interest in the term “Flu” at city level over the past 5 years in (a) Los Angeles, (b) Dallas, (c) New York, (d) Miami, (e) India, and (f) Greece.
Figure 9 depicts the online interest by city in the selected metropolitan areas of Los Angeles in California, Dallas in Texas, New York in New York, and Miami in Florida.
At metropolitan level, by selecting the “include low search volume regions,” the total of the included cities is 123 in Los Angeles, 67 in Texas, 110 New York, and 50 in Miami, while in India and Greece, the number of cities remains 7 and 2, respectively.
Period Selection
As the data are normalized over the selected period, the time frame for which Google Trends data are retrieved is crucial for the validity of the results. The selection of the examined time frame is one of the most common mistakes in Google Trends research. The main guideline is that the period selected for Google data should be exactly the same as the one for which official data are available and will be examined. For example, if monthly (or yearly) official data from January 2004 to December 2014 are available, then the selected period for retrieving Google Trends data should be January 2004 to December 2014. Neither 15 datasets for each individual year nor a random number of datasets arbitrarily chosen should be used; a single dataset should be compiled including the months from January 2004 to December 2014. Note that data may slightly vary depending on the time of retrieval; thus, the date and time of downloading must be reported.
Depending on the time frame, the interval for which data are available varies significantly (Table 3), which includes the data intervals for the preselected time frames in Google Trends. Note that the default selection is 12 months.
Table 3.
Data intervals and number of observations for the default options in period selection.
| Selected period | Data intervals | Number of observations |
| 2004 to present | Monthly | >187 |
| Past 5 years | Weekly | 260 |
| Full year (eg, 2004 or 2008) | Weekly | 52 |
| Past 12 months | Weekly | 52 |
| Past 90 days | Daily | 90 |
| Past 30 days | Daily | 30 |
| Past 7 days | Hourly | 168 |
| Past day | 8 min | 180 |
| Past 4 hours | 1 min | 240 |
| Past hour | 1 min | 60 |
The time frame can be customized at will; for example, March 24, 2007, to November 6, 2013 (Figure 10 a). Furthermore, there is an option to select the exact hours for which data are retrieved, but only over the past week; for example, from February 11, 4 am, to February 15, 5 pm (Figure 10 b).
Figure 10.
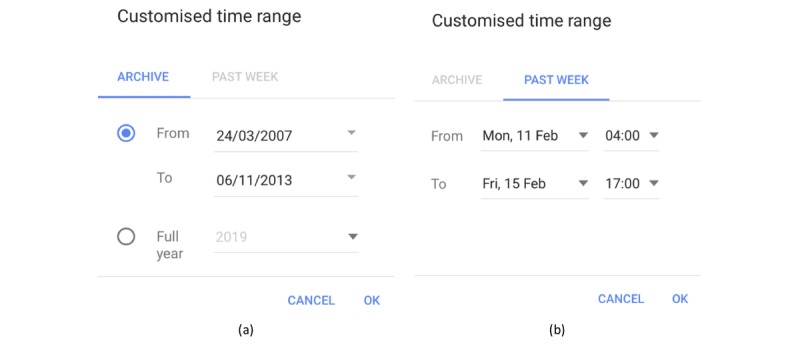
Customized time range (a) from archive and (b) over the past week.
Finally, an important detail in the selection of the time frame is when the data retrieval changes from monthly to weekly and weekly to daily. For example, from April 28, 2013, to June 30, 2018, the data are retrieved in weekly intervals, while from April 27, 2013, to June 30, 2018, the data are retrieved in monthly intervals. Hence, the data from monthly to weekly changes in (roughly) 5 years and 2 months. For daily data, we observe that, for example, from October 4, 2017, to June 30, 2018, the data are retrieved in daily intervals, while from October 3, 2017, to June 30, 2018, the data are retrieved in weekly intervals; as such, the data interval changes from daily to weekly in (roughly) 10 months.
Search Categories
When exploring the online interest, the selected term can be analyzed based on a selected category. This feature is important to eliminate noisy data, especially in cases where the same word is used or can be attributed to different meanings or events. For example, the terms “yes” and “no” are very commonly searched for, so, when aiming at predicting the results of a referendum race, the search must be limited to the category “Politics” or “Campaign and elections” in order to retrieve the data that are attributed to the event. However, selecting a category is not required when the keyword searched is specific and not related to other words, meanings, and events.
The available categories are listed in Table A1 of Multimedia Appendix 1. Note that most of these categories have subcategories, which, in turn, have other subcategories, allowing the available categories to be as broad or as narrow as required.
In this paper, we focus on the category of “Health” (first level of categorization). The main available subcategories (second level of categorization) of “Health” along with all available subcategories (third and fourth levels) are presented in Table A2 of Multimedia Appendix 1.
Finally, another feature is the type of search conducted when entering a keyword, which consists of the options of “Web Search,” “Image Search,” “News Search,”“Google Shopping,” and “YouTube Search.” Apart from very specific cases, the “Web Search,” which is also the default option, should be selected.
Discussion
Over the past decade, Web-based data are used extensively in digital epidemiology, with online sources playing a central role in health informatics [1,2,52]. Digital disease detection [53] consists of detecting, analyzing, and predicting disease occurrence and spread, and several types of online sources are used, including mainly digital platforms [54,55]. When addressing infodemiology topics, a concept first introduced by Eysenbach [1], Google Trends is an important tool, and research on the subject is constantly expanding [56]. Most studies on Google Trends research are in health and medicine, focusing mainly on the surveillance and analysis of health topics and the forecasting of diseases, outbreaks, and epidemics. As Google Trends is open and user friendly, it is accessed and used by several researchers, even those who are not strictly related to the field of big data, but use it as a means of exploring behavioral variations toward selected topics. The latter has resulted in differences in methodologies followed, which, at times, involve mistakes.
Despite the large number of studies in this line of research, there was a lack of a methodology framework that should be followed. This has produced differences in presentation, and, more importantly, in crucial mistakes that compromise the validity of the results. In this article, we provided a concise overview of the how the tool works and proposed a step-by-step methodology (ie, the four steps of selecting the correct/appropriate keyword, region, period, and category) to ensure the validity of the results in Google Trends research. We also included research examples to provide guidance not only to the experienced eye, but also to new researchers.
As is evident by the findings of this study, there are several limitations to the use of Google Trends data. First, despite the evident potential that Google data have to offer in epidemiology and disease surveillance, there have been some issues in the past, where online search traffic data at some point failed to accurately predict disease spreading, as in the case of Google Flu Trends [57], a Google tool for the surveillance of influenza-like illness (the flu) that is no longer available. Regardless, Google Flu Trends has been accurate in the past in predicting the spread of flu, as suggested by several studies and reports [58-60].
The latter could be partly attributed to the fact that, when researching with Google Trends, the sample is unknown and it cannot be shown to be representative. Despite this and considering the increasing internet penetration, previous studies have suggested that Web-based data have been empirically shown to provide valuable and valid results in exploring and predicting behavior and are correlated with actual data [61-66]. However, recent research has suggested that online queries do not provide valid results in regions with low internet penetration or low scorings in freedom of speech [67].
Furthermore, the data that are retrieved are normalized over the selected period; thus, the exact volumes of queries are not known, limiting the way that the data can be processed and analysis can be performed. Therefore, the data should be analyzed in the appropriate way, and the results should be carefully interpreted.
In addition, the selection of keyword(s) plays a very important role in ensuring the validity of the results. In some cases, the noisy data (ie, queries not attributed to the examined term) must be excluded, which are not always trivial. This can be partly overcome by selecting a specific category, which always bares the risk of excluding results that are needed for analysis.
The analysis of Google Trends data has several other limitations, as examining Web data can bear threats to validity. Careful analysis should be performed to ensure that news reporting and sudden events do not compromise the validity of the results. In addition, as the sample is unknown, several other demographic factors such as age and sex cannot be included in the analysis.
Finally, as this field of research is relatively new, there is no standard way of reporting, resulting in the same meaning of different terms, different meanings of the same term, and different abbreviations. For example, Google Trends data are referred to as relative search volumes, search volumes, online queries, online search traffic data, normalized hits, and other terms. Thus, future research should focus on developing specific coding for Google Trends research, so that a unified way of reporting is followed by all researchers in the field.
In the era of big data, the analysis of Google queries has become a valuable tool for researchers to explore and predict human behavior, as it has been suggested that online data are correlated with actual health data. The methodology framework proposed in this article for researching with Google Trends is much needed to provide guidance for using Google Trends data in health assessment, and, more importantly, to help researchers and health officials and organizations avoid common mistakes that compromise the validity of the results. As research on the subject is expanding, future work should include the coding in Google Trends research and extend this framework along with changes in the tool and the analysis methods.
Google Trends categories.
Footnotes
Conflicts of Interest: None declared.
References
- 1.Eysenbach G. Infodemiology and infoveillance: framework for an emerging set of public health informatics methods to analyze search, communication and publication behavior on the Internet. J Med Internet Res. 2009;11(1):e11. doi: 10.2196/jmir.1157. http://www.jmir.org/2009/1/e11/ v11i1e11 [DOI] [PMC free article] [PubMed] [Google Scholar]
- 2.Eysenbach G. Infodemiology and infoveillance tracking online health information and cyberbehavior for public health. Am J Prev Med. 2011 May;40(5 Suppl 2):S154–8. doi: 10.1016/j.amepre.2011.02.006.S0749-3797(11)00088-2 [DOI] [PubMed] [Google Scholar]
- 3.Nuti SV, Wayda B, Ranasinghe I, Wang S, Dreyer RP, Chen SI, Murugiah K. The use of google trends in health care research: a systematic review. PLoS One. 2014;9(10):e109583. doi: 10.1371/journal.pone.0109583. http://dx.plos.org/10.1371/journal.pone.0109583 .PONE-D-14-22976 [DOI] [PMC free article] [PubMed] [Google Scholar]
- 4.Mavragani A, Ochoa G, Tsagarakis KP. Assessing the Methods, Tools, and Statistical Approaches in Google Trends Research: Systematic Review. J Med Internet Res. 2018 Nov 06;20(11):e270. doi: 10.2196/jmir.9366. http://www.jmir.org/2018/11/e270/ v20i11e270 [DOI] [PMC free article] [PubMed] [Google Scholar]
- 5.Gamma A, Schleifer R, Weinmann W, Buadze A, Liebrenz M. Could Google Trends Be Used to Predict Methamphetamine-Related Crime? An Analysis of Search Volume Data in Switzerland, Germany, and Austria. PLoS One. 2016;11(11):e0166566. doi: 10.1371/journal.pone.0166566. http://dx.plos.org/10.1371/journal.pone.0166566 .PONE-D-16-27335 [DOI] [PMC free article] [PubMed] [Google Scholar]
- 6.Mavragani A, Ochoa G. Infoveillance of infectious diseases in USA: STDs, tuberculosis, and hepatitis. J Big Data. 2018 Sep 6;5(1) doi: 10.1186/s40537-018-0140-9. [DOI] [Google Scholar]
- 7.Mavragani A, Sampri A, Sypsa K, Tsagarakis KP. Integrating Smart Health in the US Health Care System: Infodemiology Study of Asthma Monitoring in the Google Era. JMIR Public Health Surveill. 2018 Mar 12;4(1):e24. doi: 10.2196/publichealth.8726. http://publichealth.jmir.org/2018/1/e24/ v4i1e24 [DOI] [PMC free article] [PubMed] [Google Scholar]
- 8.Simpson SS, Adams N, Brugman CM, Conners TJ. Detecting Novel and Emerging Drug Terms Using Natural Language Processing: A Social Media Corpus Study. JMIR Public Health Surveill. 2018 Jan 08;4(1):e2. doi: 10.2196/publichealth.7726. http://publichealth.jmir.org/2018/1/e2/ v4i1e2 [DOI] [PMC free article] [PubMed] [Google Scholar]
- 9.Wongkoblap A, Vadillo MA, Curcin V. Researching Mental Health Disorders in the Era of Social Media: Systematic Review. J Med Internet Res. 2017 Dec 29;19(6):e228. doi: 10.2196/jmir.7215. http://www.jmir.org/2017/6/e228/ v19i6e228 [DOI] [PMC free article] [PubMed] [Google Scholar]
- 10.Park SH, Hong SH. Identification of Primary Medication Concerns Regarding Thyroid Hormone Replacement Therapy From Online Patient Medication Reviews: Text Mining of Social Network Data. J Med Internet Res. 2018 Oct 24;20(10):e11085. doi: 10.2196/11085. http://www.jmir.org/2018/10/e11085/ v20i10e11085 [DOI] [PMC free article] [PubMed] [Google Scholar]
- 11.Ricard BJ, Marsch LA, Crosier B, Hassanpour S. Exploring the Utility of Community-Generated Social Media Content for Detecting Depression: An Analytical Study on Instagram. J Med Internet Res. 2018 Dec 06;20(12):e11817. doi: 10.2196/11817. http://www.jmir.org/2018/12/e11817/ v20i12e11817 [DOI] [PMC free article] [PubMed] [Google Scholar]
- 12.Huesch M, Chetlen A, Segel J, Schetter S. Frequencies of Private Mentions and Sharing of Mammography and Breast Cancer Terms on Facebook: A Pilot Study. J Med Internet Res. 2017 Jun 09;19(6):e201. doi: 10.2196/jmir.7508. http://www.jmir.org/2017/6/e201/ v19i6e201 [DOI] [PMC free article] [PubMed] [Google Scholar]
- 13.Chen T, Dredze M. Vaccine Images on Twitter: Analysis of What Images are Shared. J Med Internet Res. 2018 Apr 03;20(4):e130. doi: 10.2196/jmir.8221. http://www.jmir.org/2018/4/e130/ v20i4e130 [DOI] [PMC free article] [PubMed] [Google Scholar]
- 14.Farhadloo M, Winneg K, Chan MS, Hall Jamieson K, Albarracin D. Associations of Topics of Discussion on Twitter With Survey Measures of Attitudes, Knowledge, and Behaviors Related to Zika: Probabilistic Study in the United States. JMIR Public Health Surveill. 2018 Feb 09;4(1):e16. doi: 10.2196/publichealth.8186. http://publichealth.jmir.org/2018/1/e16/ v4i1e16 [DOI] [PMC free article] [PubMed] [Google Scholar]
- 15.van Lent LG, Sungur H, Kunneman FA, van de Velde B, Das E. Too Far to Care? Measuring Public Attention and Fear for Ebola Using Twitter. J Med Internet Res. 2017 Dec 13;19(6):e193. doi: 10.2196/jmir.7219. http://www.jmir.org/2017/6/e193/ v19i6e193 [DOI] [PMC free article] [PubMed] [Google Scholar]
- 16.Du Jingcheng, Tang Lu, Xiang Yang, Zhi Degui, Xu Jun, Song Hsing-Yi, Tao Cui. Public Perception Analysis of Tweets During the 2015 Measles Outbreak: Comparative Study Using Convolutional Neural Network Models. J Med Internet Res. 2018 Jul 09;20(7):e236. doi: 10.2196/jmir.9413. http://www.jmir.org/2018/7/e236/ v20i7e236 [DOI] [PMC free article] [PubMed] [Google Scholar]
- 17.Sewalk KC, Tuli G, Hswen Y, Brownstein JS, Hawkins JB. Using Twitter to Examine Web-Based Patient Experience Sentiments in the United States: Longitudinal Study. J Med Internet Res. 2018 Oct 12;20(10):e10043. doi: 10.2196/10043. http://www.jmir.org/2018/10/e10043/ v20i10e10043 [DOI] [PMC free article] [PubMed] [Google Scholar]
- 18.Chen S, Xu Q, Buchenberger J, Bagavathi A, Fair G, Shaikh S, Krishnan S. Dynamics of Health Agency Response and Public Engagement in Public Health Emergency: A Case Study of CDC Tweeting Patterns During the 2016 Zika Epidemic. JMIR Public Health Surveill. 2018 Nov 22;4(4):e10827. doi: 10.2196/10827. http://publichealth.jmir.org/2018/4/e10827/ v4i4e10827 [DOI] [PMC free article] [PubMed] [Google Scholar]
- 19.Alvarez-Mon MA, Asunsolo Del Barco A, Lahera G, Quintero J, Ferre F, Pereira-Sanchez V, Ortuño F, Alvarez-Mon M. Increasing Interest of Mass Communication Media and the General Public in the Distribution of Tweets About Mental Disorders: Observational Study. J Med Internet Res. 2018 May 28;20(5):e205. doi: 10.2196/jmir.9582. http://www.jmir.org/2018/5/e205/ v20i5e205 [DOI] [PMC free article] [PubMed] [Google Scholar]
- 20.Roccetti M, Marfia G, Salomoni P, Prandi C, Zagari RM, Gningaye KFL, Bazzoli F, Montagnani M. Attitudes of Crohn's Disease Patients: Infodemiology Case Study and Sentiment Analysis of Facebook and Twitter Posts. JMIR Public Health Surveill. 2017 Aug 09;3(3):e51. doi: 10.2196/publichealth.7004. http://publichealth.jmir.org/2017/3/e51/ v3i3e51 [DOI] [PMC free article] [PubMed] [Google Scholar]
- 21.Lu FS, Hou S, Baltrusaitis K, Shah M, Leskovec J, Sosic R, Hawkins J, Brownstein J, Conidi G, Gunn J, Gray J, Zink A, Santillana M. Accurate Influenza Monitoring and Forecasting Using Novel Internet Data Streams: A Case Study in the Boston Metropolis. JMIR Public Health Surveill. 2018 Jan 09;4(1):e4. doi: 10.2196/publichealth.8950. http://publichealth.jmir.org/2018/1/e4/ v4i1e4 [DOI] [PMC free article] [PubMed] [Google Scholar]
- 22.Google Trends. [2019-01-10]. https://trends.google.com/trends/?geo=US .
- 23.Mavragani A, Tsagarakis KP. YES or NO: Predicting the 2015 GReferendum results using Google Trends. Technological Forecasting and Social Change. 2016 Aug;109:1–5. doi: 10.1016/j.techfore.2016.04.028. [DOI] [Google Scholar]
- 24.Mavragani A, Ochoa G. Forecasting AIDS prevalence in the United States using online search traffic data. J Big Data. 2018 May 19;5(1) doi: 10.1186/s40537-018-0126-7. [DOI] [Google Scholar]
- 25.Tana JC, Kettunen J, Eirola E, Paakkonen H. Diurnal Variations of Depression-Related Health Information Seeking: Case Study in Finland Using Google Trends Data. JMIR Ment Health. 2018 May 23;5(2):e43. doi: 10.2196/mental.9152. http://mental.jmir.org/2018/2/e43/ v5i2e43 [DOI] [PMC free article] [PubMed] [Google Scholar]
- 26.Solano P, Ustulin M, Pizzorno E, Vichi M, Pompili M, Serafini G, Amore M. A Google-based approach for monitoring suicide risk. Psychiatry Res. 2016 Dec 30;246:581–586. doi: 10.1016/j.psychres.2016.10.030.S0165-1781(16)30194-9 [DOI] [PubMed] [Google Scholar]
- 27.Arora VS, Stuckler D, McKee M. Tracking search engine queries for suicide in the United Kingdom, 2004-2013. Public Health. 2016 Aug;137:147–53. doi: 10.1016/j.puhe.2015.10.015.S0033-3506(15)00425-4 [DOI] [PubMed] [Google Scholar]
- 28.Zheluk A, Quinn C, Meylakhs P. Internet search and krokodil in the Russian Federation: an infoveillance study. J Med Internet Res. 2014 Sep 18;16(9):e212. doi: 10.2196/jmir.3203. http://www.jmir.org/2014/9/e212/ v16i9e212 [DOI] [PMC free article] [PubMed] [Google Scholar]
- 29.Zhang Z, Zheng X, Zeng DD, Leischow SJ. Tracking Dabbing Using Search Query Surveillance: A Case Study in the United States. J Med Internet Res. 2016 Sep 16;18(9):e252. doi: 10.2196/jmir.5802. http://www.jmir.org/2016/9/e252/ v18i9e252 [DOI] [PMC free article] [PubMed] [Google Scholar]
- 30.Abdellaoui R, Foulquié P, Texier N, Faviez C, Burgun A, Schück S. Detection of Cases of Noncompliance to Drug Treatment in Patient Forum Posts: Topic Model Approach. J Med Internet Res. 2018 Mar 14;20(3):e85. doi: 10.2196/jmir.9222. http://www.jmir.org/2018/3/e85/ v20i3e85 [DOI] [PMC free article] [PubMed] [Google Scholar]
- 31.Allem J, Dharmapuri L, Leventhal AM, Unger JB, Boley Cruz T. Hookah-Related Posts to Twitter From 2017 to 2018: Thematic Analysis. J Med Internet Res. 2018 Nov 19;20(11):e11669. doi: 10.2196/11669. http://www.jmir.org/2018/11/e11669/ v20i11e11669 [DOI] [PMC free article] [PubMed] [Google Scholar]
- 32.Berlinberg EJ, Deiner MS, Porco TC, Acharya NR. Monitoring Interest in Herpes Zoster Vaccination: Analysis of Google Search Data. JMIR Public Health Surveill. 2018 May 02;4(2):e10180. doi: 10.2196/10180. http://publichealth.jmir.org/2018/2/e10180/ v4i2e10180 [DOI] [PMC free article] [PubMed] [Google Scholar]
- 33.Bragazzi NL, Mahroum N. Google Trends Predicts Present and Future Plague Cases During the Plague Outbreak in Madagascar: Infodemiological Study. JMIR Public Health Surveill. 2019 Mar 08;5(1):e13142. doi: 10.2196/13142. http://publichealth.jmir.org/2019/1/e13142/ v5i1e13142 [DOI] [PMC free article] [PubMed] [Google Scholar]
- 34.Foroughi F, Lam AK, Lim MSC, Saremi N, Ahmadvand A. "Googling" for Cancer: An Infodemiological Assessment of Online Search Interests in Australia, Canada, New Zealand, the United Kingdom, and the United States. JMIR Cancer. 2016 May 04;2(1):e5. doi: 10.2196/cancer.5212. http://cancer.jmir.org/2016/1/e5/ v2i1e5 [DOI] [PMC free article] [PubMed] [Google Scholar]
- 35.Gianfredi V, Bragazzi NL, Mahamid M, Bisharat B, Mahroum N, Amital H, Adawi M. Monitoring public interest toward pertussis outbreaks: an extensive Google Trends-based analysis. Public Health. 2018 Dec;165:9–15. doi: 10.1016/j.puhe.2018.09.001.S0033-3506(18)30282-8 [DOI] [PubMed] [Google Scholar]
- 36.Hswen Y, Gopaluni A, Brownstein JS, Hawkins JB. Using Twitter to Detect Psychological Characteristics of Self-Identified Persons With Autism Spectrum Disorder: A Feasibility Study. JMIR Mhealth Uhealth. 2019 Feb 12;7(2):e12264. doi: 10.2196/12264. http://mhealth.jmir.org/2019/2/e12264/ v7i2e12264 [DOI] [PMC free article] [PubMed] [Google Scholar]
- 37.Jones J, Pradhan M, Hosseini M, Kulanthaivel A, Hosseini M. Novel Approach to Cluster Patient-Generated Data Into Actionable Topics: Case Study of a Web-Based Breast Cancer Forum. JMIR Med Inform. 2018 Nov 29;6(4):e45. doi: 10.2196/medinform.9162. http://medinform.jmir.org/2018/4/e45/ v6i4e45 [DOI] [PMC free article] [PubMed] [Google Scholar]
- 38.Kandula S, Hsu D, Shaman J. Subregional Nowcasts of Seasonal Influenza Using Search Trends. J Med Internet Res. 2017 Dec 06;19(11):e370. doi: 10.2196/jmir.7486. http://www.jmir.org/2017/11/e370/ v19i11e370 [DOI] [PMC free article] [PubMed] [Google Scholar]
- 39.Keller MS, Mosadeghi S, Cohen ER, Kwan J, Spiegel BMR. Reproductive Health and Medication Concerns for Patients With Inflammatory Bowel Disease: Thematic and Quantitative Analysis Using Social Listening. J Med Internet Res. 2018 Jun 11;20(6):e206. doi: 10.2196/jmir.9870. http://www.jmir.org/2018/6/e206/ v20i6e206 [DOI] [PMC free article] [PubMed] [Google Scholar]
- 40.Mejova Y, Weber I, Fernandez-Luque L. Online Health Monitoring using Facebook Advertisement Audience Estimates in the United States: Evaluation Study. JMIR Public Health Surveill. 2018 Mar 28;4(1):e30. doi: 10.2196/publichealth.7217. http://publichealth.jmir.org/2018/1/e30/ v4i1e30 [DOI] [PMC free article] [PubMed] [Google Scholar]
- 41.Odlum M, Yoon S, Broadwell P, Brewer R, Kuang D. How Twitter Can Support the HIV/AIDS Response to Achieve the 2030 Eradication Goal: In-Depth Thematic Analysis of World AIDS Day Tweets. JMIR Public Health Surveill. 2018 Nov 22;4(4):e10262. doi: 10.2196/10262. http://publichealth.jmir.org/2018/4/e10262/ v4i4e10262 [DOI] [PMC free article] [PubMed] [Google Scholar]
- 42.Phillips CA, Barz LA, Li Y, Schapira MM, Bailey LC, Merchant RM. Relationship Between State-Level Google Online Search Volume and Cancer Incidence in the United States: Retrospective Study. J Med Internet Res. 2018 Jan 08;20(1):e6. doi: 10.2196/jmir.8870. http://www.jmir.org/2018/1/e6/ v20i1e6 [DOI] [PMC free article] [PubMed] [Google Scholar]
- 43.Poirier Canelle, Lavenu Audrey, Bertaud Valérie, Campillo-Gimenez Boris, Chazard Emmanuel, Cuggia Marc, Bouzillé Guillaume. Real Time Influenza Monitoring Using Hospital Big Data in Combination with Machine Learning Methods: Comparison Study. JMIR Public Health Surveill. 2018 Dec 21;4(4):e11361. doi: 10.2196/11361. http://publichealth.jmir.org/2018/4/e11361/ v4i4e11361 [DOI] [PMC free article] [PubMed] [Google Scholar]
- 44.Radin M, Sciascia S. Infodemiology of systemic lupus erythematous using Google Trends. Lupus. 2017 Jul;26(8):886–889. doi: 10.1177/0961203317691372. [DOI] [PubMed] [Google Scholar]
- 45.Vasconcellos-Silva PR, Carvalho DBF, Trajano V, de La Rocque Lucia Rodriguez, Sawada ACMB, Juvanhol LL. Using Google Trends Data to Study Public Interest in Breast Cancer Screening in Brazil: Why Not a Pink February? JMIR Public Health Surveill. 2017 Apr 06;3(2):e17. doi: 10.2196/publichealth.7015. http://publichealth.jmir.org/2017/2/e17/ v3i2e17 [DOI] [PMC free article] [PubMed] [Google Scholar]
- 46.Wakamiya S, Kawai Y, Aramaki E. Twitter-Based Influenza Detection After Flu Peak via Tweets With Indirect Information: Text Mining Study. JMIR Public Health Surveill. 2018 Sep 25;4(3):e65. doi: 10.2196/publichealth.8627. http://publichealth.jmir.org/2018/3/e65/ v4i3e65 [DOI] [PMC free article] [PubMed] [Google Scholar]
- 47.Wang H, Chen D. Economic Recession and Obesity-Related Internet Search Behavior in Taiwan: Analysis of Google Trends Data. JMIR Public Health Surveill. 2018 Apr 06;4(2):e37. doi: 10.2196/publichealth.7314. http://publichealth.jmir.org/2018/2/e37/ v4i2e37 [DOI] [PMC free article] [PubMed] [Google Scholar]
- 48.Watad A, Watad S, Mahroum N, Sharif K, Amital H, Bragazzi NL, Adawi M. Forecasting the West Nile Virus in the United States: An Extensive Novel Data Streams-Based Time Series Analysis and Structural Equation Modeling of Related Digital Searching Behavior. JMIR Public Health Surveill. 2019 Feb 28;5(1):e9176. doi: 10.2196/publichealth.9176. http://publichealth.jmir.org/2019/1/e9176/ v5i1e9176 [DOI] [PMC free article] [PubMed] [Google Scholar]
- 49.Xu C, Wang Y, Yang H, Hou J, Sun L, Zhang X, Cao X, Hou Y, Wang L, Cai Q, Wang Y. Association Between Cancer Incidence and Mortality in Web-Based Data in China: Infodemiology Study. J Med Internet Res. 2019 Jan 29;21(1):e10677. doi: 10.2196/10677. http://www.jmir.org/2019/1/e10677/ v21i1e10677 [DOI] [PMC free article] [PubMed] [Google Scholar]
- 50.Google Trends. [2019-01-10]. How Trends data is adjusted https://support.google.com/trends/answer/4365533?hl=en-GB&ref_topic=6248052 .
- 51.Scharkow M, Vogelgesang J. Measuring the Public Agenda using Search Engine Queries. International Journal of Public Opinion Research. 2011 Mar 01;23(1):104–113. doi: 10.1093/ijpor/edq048. [DOI] [Google Scholar]
- 52.Salathé M, Bengtsson L, Bodnar TJ, Brewer DD, Brownstein JS, Buckee C, Campbell EM, Cattuto C, Khandelwal S, Mabry PL, Vespignani A. Digital epidemiology. PLoS Comput Biol. 2012 Jul;8(7):e1002616. doi: 10.1371/journal.pcbi.1002616. http://dx.plos.org/10.1371/journal.pcbi.1002616 .PCOMPBIOL-D-12-00494 [DOI] [PMC free article] [PubMed] [Google Scholar]
- 53.Brownstein J, Freifeld Clark C, Madoff Lawrence C. Digital disease detection--harnessing the Web for public health surveillance. N Engl J Med. 2009 May 21;360(21):2153–-5,2157. doi: 10.1056/NEJMp0900702. http://europepmc.org/abstract/MED/19423867 .NEJMp0900702 [DOI] [PMC free article] [PubMed] [Google Scholar]
- 54.Chunara R, Goldstein E, Patterson-Lomba O, Brownstein JS. Estimating influenza attack rates in the United States using a participatory cohort. Sci Rep. 2015 Apr 2;5(1) doi: 10.1038/srep09540. [DOI] [PMC free article] [PubMed] [Google Scholar]
- 55.Leal-Neto Onicio B, Dimech George S, Libel Marlo, Oliveira Wanderson, Ferreira Juliana Perazzo. Digital disease detection and participatory surveillance: overview and perspectives for Brazil. Rev Saude Publica. 2016;50:17. doi: 10.1590/S1518-8787.2016050006201. http://www.scielo.br/scielo.php?script=sci_arttext&pid=S0034-89102016000100702&lng=en&nrm=iso&tlng=en .S0034-89102016000100702 [DOI] [PMC free article] [PubMed] [Google Scholar]
- 56.Bernardo TM, Rajic A, Young I, Robiadek K, Pham MT, Funk JA. Scoping review on search queries and social media for disease surveillance: a chronology of innovation. J Med Internet Res. 2013;15(7):e147. doi: 10.2196/jmir.2740. http://www.jmir.org/2013/7/e147/ v15i7e147 [DOI] [PMC free article] [PubMed] [Google Scholar]
- 57.Google Flu Trends Data. [2019-02-09]. https://www.google.org/flutrends/about/
- 58.Carneiro Ha, Mylonakis E. Google trends: a web-based tool for real-time surveillance of disease outbreaks. Clin Infect Dis. 2009 Nov 15;49(10):1557–64. doi: 10.1086/630200. [DOI] [PubMed] [Google Scholar]
- 59.Dugas AF, Jalalpour M, Gel Y, Levin S, Torcaso F, Igusa T, Rothman RE. Influenza forecasting with Google Flu Trends. PLoS One. 2013 Feb;8(2):e56176. doi: 10.1371/journal.pone.0056176. http://dx.plos.org/10.1371/journal.pone.0056176 .PONE-D-12-29961 [DOI] [PMC free article] [PubMed] [Google Scholar]
- 60.Eurosurveillance editorial team Google Flu Trends includes 14 European countries. Euro Surveill. 2009;14(40) doi: 10.2807/ese.14.40.19352-en. doi: 10.2807/ese.14.40.19352-en. [DOI] [PubMed] [Google Scholar]
- 61.Mavragani A, Ochoa G. The Internet and the Anti-Vaccine Movement: Tracking the 2017 EU Measles Outbreak. BDCC. 2018 Jan 16;2(1):2. doi: 10.3390/bdcc2010002. [DOI] [Google Scholar]
- 62.Preis T, Moat HS, Stanley HE, Bishop SR. Quantifying the advantage of looking forward. Sci Rep. 2012;2:350. doi: 10.1038/srep00350. doi: 10.1038/srep00350. [DOI] [PMC free article] [PubMed] [Google Scholar]
- 63.Preis T, Moat HS, Stanley HE. Quantifying trading behavior in financial markets using Google Trends. Sci Rep. 2013;3:1684. doi: 10.1038/srep01684. doi: 10.1038/srep01684.srep01684 [DOI] [PMC free article] [PubMed] [Google Scholar]
- 64.Mavragani A, Sypsa K, Sampri A, Tsagarakis K. Quantifying the UK Online Interest in Substances of the EU Watchlist for Water Monitoring: Diclofenac, Estradiol, and the Macrolide Antibiotics. Water. 2016 Nov 18;8(11):542. doi: 10.3390/w8110542. [DOI] [Google Scholar]
- 65.Eysenbach G. Infodemiology: tracking flu-related searches on the web for syndromic surveillance. AMIA Annu Symp Proc. 2006:244–8. http://europepmc.org/abstract/MED/17238340 .86095 [PMC free article] [PubMed] [Google Scholar]
- 66.Jun S, Yoo HS, Choi S. Ten years of research change using Google Trends: From the perspective of big data utilizations and applications. Technological Forecasting and Social Change. 2018 May;130:69–87. doi: 10.1016/j.techfore.2017.11.009. [DOI] [Google Scholar]
- 67.Mavragani A, Tsagarakis KP. Predicting referendum results in the Big Data Era. J Big Data. 2019 Jan 14;6:3. doi: 10.1186/s40537-018-0166-z. [DOI] [Google Scholar]
Associated Data
This section collects any data citations, data availability statements, or supplementary materials included in this article.
Supplementary Materials
Google Trends categories.


