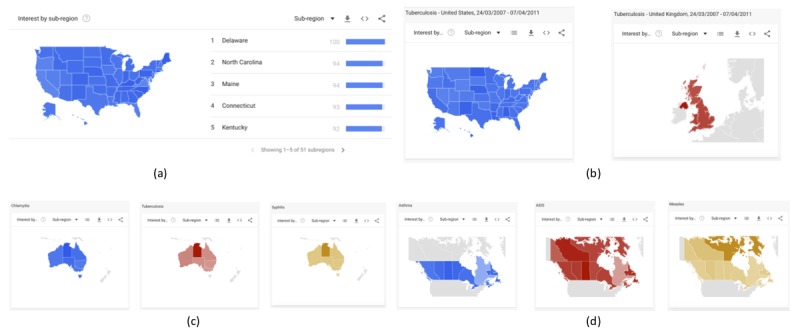
Figure 2.

Heat map for (a) “Asthma” in the United States from Jan 2004 to Dec 2014; (b) “Tuberculosis” in the United States and United Kingdom from March 24, 2007, to April 7, 2011; (c) “Chlamydia,” “Tuberculosis,” and “Syphilis” in Australia from Oct 5, 2012, to Dec 18, 2012; (d) “Asthma” in the United States, “AIDS” in the United Kingdom, and “Measles” in Canada from June 1, 2017, to July 15, 2018.
