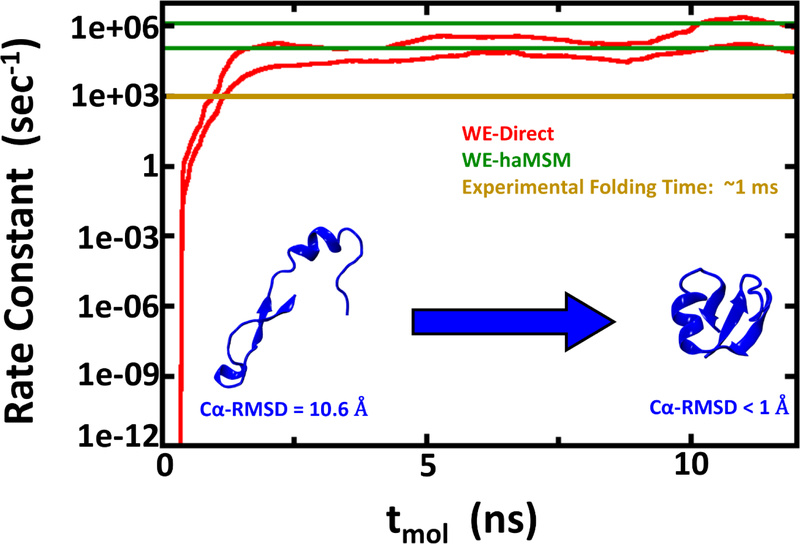
Figure 2:
Rate constant estimations for NTL9 folding using 2D WE method with solvent viscosity (γ) set to 5 ps−1. The red lines show the nominal 95% Credibility Region (CR) as a function of molecular time from Bayesian bootstrapping based on direct WE rate constant estimates, which were windowed averages of the previous 1 ns of molecular time for each of the 10 independent simulations (see Figure S1). The green lines show the 95% CR for rate constants obtained by the haMSM method. The experimental rate constant is shown in gold, but note that the low viscosity used in these simulations is expected to yield overly fast kinetics.

