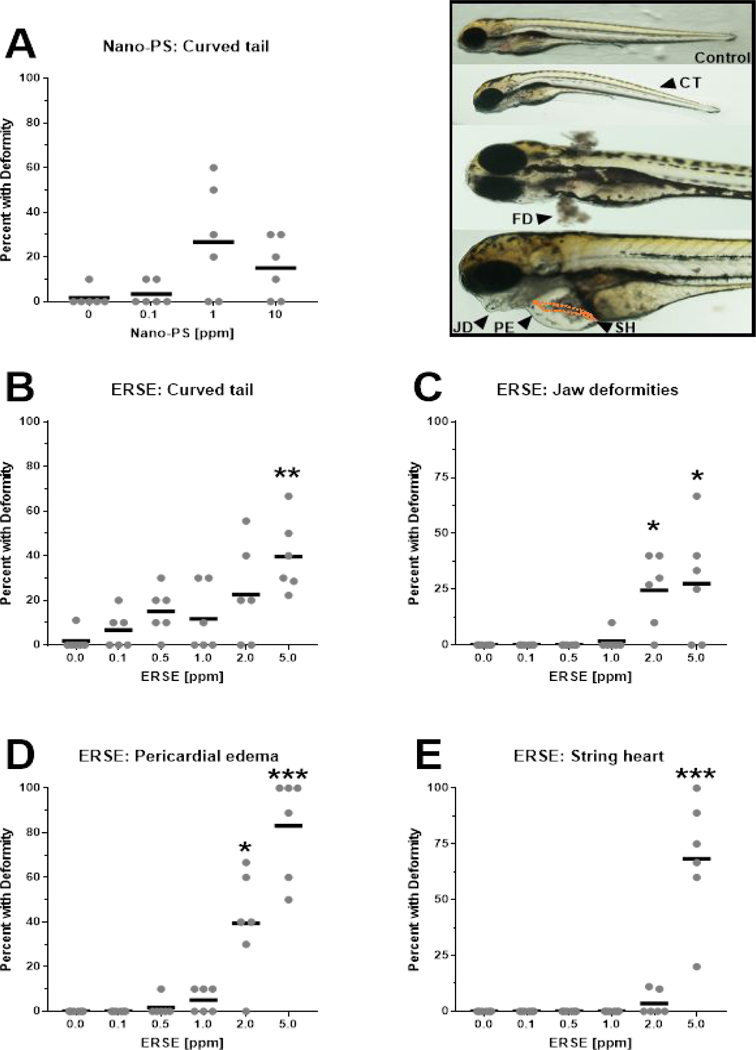
Figure 1:

Deformities rates of zebrafish larvae exposed to 44 nm nanopolystyrene particles (Nano-PS) (A) or a real-world environmental PAH mixture (Elizabeth River Sediment Extract – ERSE) (B -E). Animals were exposed at 6 hours post fertilization (hpf) to the indicated Nano-PS and ERSE concentrations, and the deformities were assessed at 96 hpf. The top right image panel shows representative images of the detected deformities: curved tail (CT), fin (FD) and jaw (JD) deformities, pericardial edema (PE) and string heart (SH, highlighted in orange dashed line). Results are presented as scatter plot (n = 6) and mean (black bar). Data were analyzed by Kruskal-Wallis followed by Dunn’s posthoc, and differences against control are shown as * (p < 0.05), ** (p < 0.01) or *** (p < 0.001).
