
Figure 4:
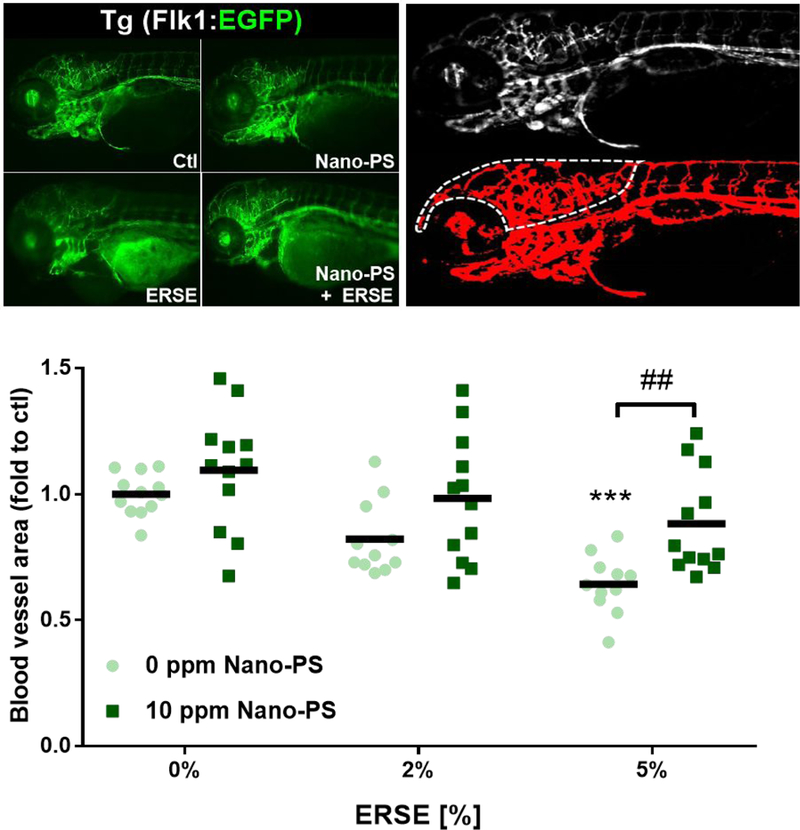
Blood vessel formation in zebrafish larvae exposed to 44 nm nanopolystyrene particles (Nano-PS) in the presence of a real world environmental PAH mixture (Elizabeth River Sediment Extract – ERSE). Animals were co-exposed at 6 hours post fertilization (hpf) to 10 ppm Nano-PS and 2% or 5% ERSE. Blood vessels were assessed in vivo at 96 hpf by fluorescence microscopy using the transgenic line Tg (Flk1:EGFP), as shown in the top left panel. Further image analysis identified the blood vessels (red, top right panel) and quantified total blood vessel area in the head (dashed line, top right panel). Results are presented as scatter plot (n = 11 – 12) and mean (black bar). Data were analyzed by two-way ANOVA followed by Tukey’s posthoc. Differences against the respective control group are shown as *** (p < 0.001), while differences between ERSE and ERSE + Nano-PS exposures are shown as ## (p < 0.01).